- Professional Development
- Medicine & Nursing
- Arts & Crafts
- Health & Wellbeing
- Personal Development
1448 Courses in Cardiff delivered Live Online
Tableau Desktop - Part 2
By Nexus Human
Duration 2 Days 12 CPD hours This course is intended for This course is designed for professionals in a variety of job roles who are currently using Tableau to perform numerical or general data analysis, visualization, and reporting. They need to provide data visualizations from multiple data sources, or combine data to show comparisons, manipulate data through calculations, create interactive visualizations, or create visualizations that showcase insights from statistical analysis. This course is also designed for students who plan to obtain Tableau Desktop Certified Associate certification, which requires candidates to pass the Tableau Desktop Certified Associate exam. Overview Blend data multiple sources. Join data. Access data in PDFs. Refine visualizations with sets and parameters. Analyze data with calculations. Visualize data with advanced calculations. Perform statistical analysis and forecasting. Create geographic visualizations. Get answers with Ask and Explain The advent of cloud computing and storage has ushered in the era of "big data." With the abundance of computational power and storage, organizations and employees with many different roles and responsibilities can benefit from analyzing data to find timely insights and gain competitive advantage. Data-backed visualizations allow anyone to explore, analyze, and report insights and trends from data. Tableau© software is designed for this purpose. Tableau was built to connect to a wide range of data sources and allows users to quickly create visualizations of connected data to gain insights, show trends, and create reports. Beyond the fundamental capabilities of creating data driven visualizations, Tableau allows users to manipulate data with calculations to show insights, make visualizations interactive, and perform statistical analysis. This gives users the ability to create and share data driven insights with peers, executives, and clients. Prerequisites Tableau Desktop: Part 1 Lesson 1: Blending Data from Multiple Sources Topic A: Blend Data Topic B: Refine Blends to Visualize Key Information Lesson 2: Joining Data Topic A: Create Joins Topic B: Troubleshoot Joins Topic C: Merge Data with Unions Lesson 3: Accessing Data in PDFs Topic A: Connect to PDFs Topic B: Clean Up and Organize PDF Data Lesson 4: Refining Visualizations with Sets and Parameters Topic A: Create Sets Topic B: Analyze Data with Sets Topic C: Apply Parameters to Refine Visualizations Topic D: Create Advanced Visualizations Lesson 5: Analyzing Data with Calculations Topic A: Create Calculated Fields to Analyze Data Topic B: Manipulate Data with Functions Topic C: Analyze Data with Table Calculations Lesson 6: Visualizing Data with Advanced Calculations Topic A: Create Groups and Bins with Calculations Topic B: Analyze Data with LOD Expressions Lesson 7: Performing Statistical Analysis and Forecasting Topic A: Perform Statistical Analysis Topic B: Forecast Data Trends Lesson 8: Creating Geographic Visualizations Topic A: Create Maps Topic B: Customize Mapped Data Lesson 9: Getting Answers with Ask and Explain Topic A: Ask Data Topic B: Explain Data Additional course details: Nexus Humans Tableau Desktop - Part 2 training program is a workshop that presents an invigorating mix of sessions, lessons, and masterclasses meticulously crafted to propel your learning expedition forward. This immersive bootcamp-style experience boasts interactive lectures, hands-on labs, and collaborative hackathons, all strategically designed to fortify fundamental concepts. Guided by seasoned coaches, each session offers priceless insights and practical skills crucial for honing your expertise. Whether you're stepping into the realm of professional skills or a seasoned professional, this comprehensive course ensures you're equipped with the knowledge and prowess necessary for success. While we feel this is the best course for the Tableau Desktop - Part 2 course and one of our Top 10 we encourage you to read the course outline to make sure it is the right content for you. Additionally, private sessions, closed classes or dedicated events are available both live online and at our training centres in Dublin and London, as well as at your offices anywhere in the UK, Ireland or across EMEA.

Autodesk Maya 10 hrs One to One training
By Real Animation Works
Autodesk face to face training customised and bespoke. Certified Tutors.
Fundamentals of E&P Data Management
By EnergyEdge - Training for a Sustainable Energy Future
About this Virtual Instructor Led Training (VILT) The energy industry has started its journey to be more data centric by embracing the industry 4.0 concept. As a result, data management - which was considered until recently as a back-office service to support geoscience, reservoir management, engineering, production and maintenance - is now given the spotlight! To become an active stakeholder in this important transition in E&P data management, it is necessary to understand the new technical opportunities offered by the Cloud, Artificial Intelligence and how data governance can pave the way towards more reliable and resilient processes within E&P domain. Several key questions that need to be addressed: Why place more focus on data assets? Is data management just about serving geoscientists or engineers with fresh data? What is the value of data management in the E&P sector for decision making? How to convince the data consumers that the data we provide is reliable? Is the data architecture of my organization appropriate and sustainable? The purpose of this 5 half-day Virtual Instructor Led Training (VILT) course is to present the data challenges facing the energy organizations today and see how they practically solve them. The backbone of this course is based on the DAMA Book of Knowledge for Data Management. The main data management activities are described in sequence with a particular focus on recent technological developments. Training Objectives Upon completion of this VILT course, the participants will be able to: Understand why the data asset is now considered as a main asset by energy organizations Appreciate the importance of data governance and become an active stakeholder of it Understand the architecture and implementation of data structure in their professional environment Get familiarized with the more important data management activities such as data security and data quality Integrate their subsurface and surface engineering skills with the data managements concepts This VILT course is unique on several points: All notions are explained by some short presentations. For each of them, a set of video, exercises, quizzes will be provided to help develop an engaging experience between the trainer and the participants A pre-course questionnaire to help the trainer focus on the participants' needs and learning objectives A detailed reference manual A lexicon of terms for data-management Limited class size to encourage the interactivity Target Audience This VILT course is intended for: Junior/new data managers Geoscientists Reservoir engineers Producers Maintenance specialists Construction specialists Human resources Legal Course Level Basic or Foundation Training Methods The VILT course will be delivered online in 5 half-days consisting 4 hours per day, with 2 breaks of 10 minutes per day. Course Duration: 5 half-day sessions, 4 hours per session (20 hours in total). Trainer Your expert course leader is a geologist by education who has dedicated his career to subsurface data management services. In 2016, he initiated a tech startup dedicated to Data Management using Artificial Intelligence (AI) tools. He is heavily involved in developing business plans, pricing strategies, partnerships, marketing and SEO, and is the co-author of several Machine Learning publications. He also delivers training on Data Management and Data Science to students and professionals. Based in France, he was formerly Vice President, Sales & Marketing at CGG where he was in charge of the Data Management Services strategy, Sales Manager at Spie O&G Services where he initiated the Geoscience technical assistance activities and Product Manager of interactive seismic inversion software design and marketing at Paradigm. POST TRAINING COACHING SUPPORT (OPTIONAL) To further optimise your learning experience from our courses, we also offer individualized 'One to One' coaching support for 2 hours post training. We can help improve your competence in your chosen area of interest, based on your learning needs and available hours. This is a great opportunity to improve your capability and confidence in a particular area of expertise. It will be delivered over a secure video conference call by one of our senior trainers. They will work with you to create a tailor-made coaching program that will help you achieve your goals faster. Request for further information about post training coaching support and fees applicable for this. Accreditions And Affliations

AAT Distance Learning
By Osborne Training
AAT Distance Learning AAT Distance Learning simply allows you to study at a time and place to suit you, whether that be at home or at work. We understand that it can sometimes be difficult to get to a centre, for various reasons. That's why distance learning offers you the perfect way to fit your studies around your daily commitments, instead of the other way round, which is often the case. Our friendly course advisers will supply you with all of the learning materials such as course books, workbooks and software required to get you started. Moreover, you would get access to our State of the art VLC (Virtual Learning Campus), where you would be able to access ample study resources to support your studies. Moreover, with AAT home study, from time to time you can contact your personal tutor by email or by phone if you have any issue . For AAT distance learning courses courses we deliver the study books to your home address. In summary, AAT Distance Learning courses are self study method with tutorial support and you do not have to join any lecture sessions as you study according to your own pace. AAT Level 2 Distance learning course covers Coursebooks and workbooks delivered to your home address. Access to VLC or online student portal for additional aat study materials. Sage 50 Accounts software included in the study package. 4 computer based tests and 1 final Synoptic assessment. AAT Level 3 Distance learning course covers No of Coursebooks and workbooks delivered to your home address. Access to VLC(Virtual Learning Campus) or online student portal for additional aat study materials. 4 computer based tests and 1 final Synoptic assessment at an approved AAT Exam Centre. AAT Level 4 Distance learning course covers Coursebooks and workbooks for chosen subjects delivered to your home address. Access to VLC(Virtual Learning Campus) or online student portal for additional aat study materials. 5 computer based tests and 1 final Synoptic assessment at an approved AAT Assessment venue.

AutoCAD Training Courses Evening
By London Design Training Courses
Learn AutoCAD Evening Training Course. Clickhere for info This Autodesk AutoCAD 2D Introduction Evening Course is ideal for students who are completely new to the software and for those looking to produce advanced 2D plans, elevations and sections, as well as understanding all key tools in AutoCAD 2D. Call 02077202581 or WhatsApp 07970325184. Duration: 10 hrs. Method: 1-on-1, Personalized attention Schedule: Tailor your own slots, available from Mon to Sat between 9 am and 7 pm. Flexible Evening Sessions: Learn at your pace with evening classes. Comprehensive Skill Development: Master 2D Plans, Sections and Elevations. Industry-Standard Knowledge: Gain proficiency sought by employers. Practical Application: Apply skills to real-world design scenarios. Recorded Lessons for Review: Revisit course material anytime. Lifetime Email Support: Get ongoing assistance even after course completion. Course Duration: 10 hours Course Overview: AutoCAD 2D Training Course Designed for beginners, this course teaches the fundamentals of AutoCAD 2D software. Participants will learn essential tools and features to create, edit, and annotate 2D drawings. By course completion, students will confidently produce their own 2D drawings using AutoCAD. Introduction to AutoCAD 2D Overview of AutoCAD 2D software Understanding the user interface Navigating the drawing area Setting up drawing units and limits Creating basic shapes and lines Drawing Tools Utilizing Line, Circle, and Arc tools Implementing Polyline and Spline tools Adding dimensions and annotations Understanding layers and object properties Creating and inserting blocks into drawings Editing Tools Using Erase, Move, and Copy tools Implementing Rotate and Scale tools Understanding grips and grip editing Utilizing Trim and Extend tools Exploring fillets and chamfers Advanced Drawing Tools Utilizing Offset and Mirror tools Implementing Array and Divide tools Understanding hatching and gradient fills Adding text and multiline text Incorporating tables and fields into drawings Final Project Completing a final project using all learned tools and features Instructor-guided process to create a personal 2D drawing with AutoCAD Q&A and review of course material Assessment: Submission of the final project Active participation in class exercises and discussions Requirements: AutoCAD 2D software installed on the student's computer Basic computer skills and familiarity with the Windows operating system A laptop or desktop computer with a minimum of 4GB RAM and a 64-bit operating system.

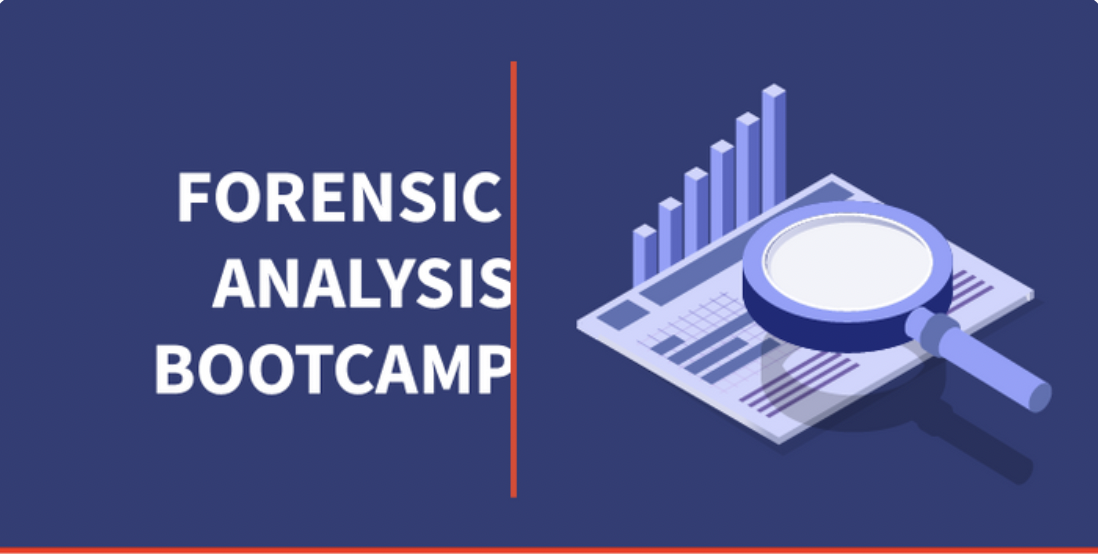
FORENSIC ANALYSIS BOOTCAMP
By Behind The Balance Sheet
The Forensic Analysis Bootcamp is an 8-week deep-dive into forensic equity analysis, featuring a 90-minute Zoom workshop each week. The content includes extensive use of real-life case studies and covers stocks spanning a wide range of sectors and regions. You will learn how companies manipulate expenses and inflate profits, how to spot balance sheet issues, weaknesses of the cash flow statement and issues and more.
55128 Writing Reports with Report Builder and SSRS Level 2
By Nexus Human
Duration 2 Days 12 CPD hours This course is intended for The primary audience for this course are persons who are new to reporting with Microsoft© SQL Server© Report Builder and SSRS, persons who are transitioning from another reporting software application, and persons who are existing Report Builder and SSRS report authors. The secondary audience for this course are persons who are using Report Designer (SSRS). Course participants may be business analysts, programmer analysts, data analysts, database administrators, or IT professionals and may or may not have experience with Microsoft© SQL Server© Report Builder and SSRS, programming (Visual Basic), and/or Transact-Structured Query Language (T-SQL) experience. Overview After completing this course, students will be able to: Create parameter reports. Create list reports. Format reports with complex expressions. Add images and subreports. Add drilldown and drillthrough functionality. Add sparklines, data bars, and indicators. In this course, students will continue their learning on the foundations of report writing with Microsoft© SQL Server© Report Builder and SSRS. The focus will be on report creation by connecting to a database and manipulating the data. 1 - Parameter Reports Parameterized Reporting Create Report Parameters Modify Report Parameters Provide Default Parameter Values Provide Available Values for Parameters Lab: Creating Parameterized Reports 2 - List Data Regions Introducing the List Data Region Create Reports Using List Data Regions Modify Reports Which Use List Data Regions Lab: Creating List Reports 3 - Enhancing Reports with Complex Expressions Formatting Reports Top N Reports Running Values Lab: Enhancing Reports with Complex Expressions 4 - Enhance Reports with Images and Subreports Add Images to Reports Retrieve Images from a Database Introducing SSRS (SQL Server Reporting Services) Report Server Add Subreports to Reports Lab: Working With Images and Subreports 5 - Drilldown and Drillthrough Reports Add and Configure Drilldown Reporting Add and Configure Drillthrough Reporting Lab: Add Drilldown and Drillthrough Functionality to Reports 6 - Sparklines, Data Bars, and Indicators Sparklines Data Bars Indicators Lab: Adding Sparklines, Data Bars, and Indicators to Reports Additional course details: Nexus Humans 55128 Writing Reports with Report Builder and SSRS Level 2 training program is a workshop that presents an invigorating mix of sessions, lessons, and masterclasses meticulously crafted to propel your learning expedition forward. This immersive bootcamp-style experience boasts interactive lectures, hands-on labs, and collaborative hackathons, all strategically designed to fortify fundamental concepts. Guided by seasoned coaches, each session offers priceless insights and practical skills crucial for honing your expertise. Whether you're stepping into the realm of professional skills or a seasoned professional, this comprehensive course ensures you're equipped with the knowledge and prowess necessary for success. While we feel this is the best course for the 55128 Writing Reports with Report Builder and SSRS Level 2 course and one of our Top 10 we encourage you to read the course outline to make sure it is the right content for you. Additionally, private sessions, closed classes or dedicated events are available both live online and at our training centres in Dublin and London, as well as at your offices anywhere in the UK, Ireland or across EMEA.
55265 Microsoft© PowerApps
By Nexus Human
Duration 2 Days 12 CPD hours This course is intended for This class has something for everything, from beginners who wish to customise their data entry forms in SharePoint right up to advanced users who need to use advanced formulas to deliver more bespoke actions to their apps. Overview After taking this course, students will be able to: - Understand when to use PowerApp. - Describe the components of PowerApps and their correct use. - Create PowerApps from existing data sources. - Brand PowerApps. - Customize PowerApps beyond just using the automated wizards. - Connect to a range of data sources from Excel to Azure SQL. - Understand the difference between canvas apps and model-driven apps. - Integrate PowerApps with other Office 365 systems ? including Teams and SharePoint Online. - Administer and Maintain PowerApps Students will be taught how to design, test and publish new apps that work with a variety of data sources. We will take users through a selection of well-crafted lessons to help them build new applications for their business. 1 - AN INTRODUCTION TO POWERAPPS What is PowerApps? The benefits of apps How to get PowerApps Canvas Apps and Model-Driven Apps License Options and Costs Discover PowerApps with Templates Lab 1: Introduction to PowerApps 2 - GETTING STARTED WITH POWERAPPS Building a new app from a data source Add, edit and remove controls Intro to Formulas Testing an app App Settings Publish and Share Apps Version History and Restore PowerApps Mobile App Lab 1: Getting Started 3 - BRANDING AND MEDIA Less is more Duplicate Screens Fonts Screen Colours and Matching Colours Screen Backgrounds Buttons and Icons Hide on Timer Size and Alignment by reference Show and Hide on Timer Lab 1: Branding and Media 4 - POWERAPPS CONTROLS Text Controls for Data Entry and Display Controls ? Drop downs, combo box, date picker, radio button and more Forms ? Add and edit data in underlying data sources quickly Charts ? present information in pie, line and bar charts Lab 1: Build Apps from Blank 5 - DATA SOURCES AND LOGIC Data Storage and Services How do I decide which database to use? Connect to on-premises data - Gateway What is Delegation? Specific Data Examples Displaying Data Lab 1: Data Source and Logic 6 - MODEL-DRIVEN APPS What is a model-driven app? Where will my data be stored? How do create a model-driven app Canvas vs model-driven summary Lab 1: Model-Driven App 7 - POWERAPP INTEGRATION Embed PowerApps in Teams Embed PowerApps in SharePoint Online Start a Flow from a PowerApp Lab 1: PowerApp Integration 8 - ADMINISTRATION AND MAINTENANCE OF POWERAPPS Identify which users have been using PowerApps Reuse an app in another location (move from testing or development to production) Review app usage Prevent a user from using PowerApps Manage environments Lab 1: Administration and Maintenance Additional course details: Nexus Humans 55265 Microsoft PowerApps training program is a workshop that presents an invigorating mix of sessions, lessons, and masterclasses meticulously crafted to propel your learning expedition forward. This immersive bootcamp-style experience boasts interactive lectures, hands-on labs, and collaborative hackathons, all strategically designed to fortify fundamental concepts. Guided by seasoned coaches, each session offers priceless insights and practical skills crucial for honing your expertise. Whether you're stepping into the realm of professional skills or a seasoned professional, this comprehensive course ensures you're equipped with the knowledge and prowess necessary for success. While we feel this is the best course for the 55265 Microsoft PowerApps course and one of our Top 10 we encourage you to read the course outline to make sure it is the right content for you. Additionally, private sessions, closed classes or dedicated events are available both live online and at our training centres in Dublin and London, as well as at your offices anywhere in the UK, Ireland or across EMEA.
55123 Writing Reports with Report Builder and SSRS Level 1
By Nexus Human
Duration 2 Days 12 CPD hours This course is intended for The primary audience for this course are persons who are new to reporting with Microsoft© SQL Server© Report Builder and SSRS, persons who are transitioning from another reporting software application, and persons who are existing Report Builder and SSRS report authors. Overview Navigate the Report Builder Environment. - Create table reports. - Format reports. - Create basic and complex expressions. - Group report data. - Create matrix reports. - Sort and filter data. - Summarize data with charts. - Print and export reports. In this course, students will continue their learning on the foundations of report writing with Microsoft© SQL Server© Report Builder and SSRS. Prerequisites ?Familiarity with Windows. ?Creating and navigating folders. ?Opening programs. ?Manipulating windows. ?Copying and pasting objects. ?Formatting text. ?Saving files. 1 - Exploring the Report Builder Environment Introducing the Report Builder Environment Working with Existing Reports Lab 1: Exploring the Report Builder Application 2 - Adding Data to Table Reports Create Report Data Sources Create Report Datasets Work with the Tablix Data Region Create a Table Report Lab 1: Creating Table Reports 3 - Formatting Data and Creating Expressions in Reports Formatting Reports Sorting and Filtering Report Data Adding Data to a Dataset Creating Simple Expressions Creating Complex Expressions Lab 1: Formatting Reports 4 - Grouping Report Data Group Data in Reports Group Data Using an Expression Creating Subgroups and Group Aggregates Lab 1: Creating Reports with Groups and Aggregates 5 - Matrix Reports Creating and Modifying Matrix Data Regions Creating and Modifying Column Groups Lab 1: Creating Matrix Reports 6 - Charts Create and Modify Chart Wizard Reports Add Charts to Existing Reports Modify Charts in Reports Lab 1: Creating Charts and Chart Reports 7 - Printing and Exporting Reports Print Features and Print Options Export Reports Lab 1: Printing and Exporting Reports
DP-080T00 Querying Data with Microsoft Transact-SQL
By Nexus Human
Duration 2 Days 12 CPD hours This course is intended for This course can be valuable for anyone who needs to write basic SQL or Transact-SQL queries. This includes anyone working with data as a data analyst, a data engineer, a data scientist, a database administrator or a database developer. It can also be useful for others peripherally involved with data, or wanting to learn more about working with data such as solution architects, students and technology managers. This course will teach the basics of Microsoft's dialect of the standard SQL language: Transact-SQL. Topics include both querying and modifying data in relational databases that are hosted in Microsoft SQL Server-based database systems, including: Microsoft SQL Server, Azure SQL Database and, Azure Synapse Analytics. 1 - Introduction to Transact-SQL Work with schemas Explore the structure of SQL statements Examine the SELECT statement Work with data types Handle NULLs 2 - Sort and filter results in T-SQL Sort your results Limit the sorted results Page results Remove duplicates Filter data with predicates 3 - Combine multiple tables with JOINs in T-SQL Understand joins concepts and syntax Use inner joins Use outer joins Use cross joins Use self joins 4 - Write Subqueries in T-SQL Understand subqueries Use scalar or multi-valued subqueries Use self-contained or correlated subqueries 5 - Use built-in functions and GROUP BY in Transact-SQL Categorize built-in functions Use scalar functions Use ranking and rowset functions Use aggregate functions Summarize data with GROUP BY Filter groups with HAVING 6 - Modify data with T-SQL Insert data Generate automatic values Update data Delete data Merge data based on multiple tables Additional course details: Nexus Humans DP-080T00 Querying Data with Microsoft Transact-SQL training program is a workshop that presents an invigorating mix of sessions, lessons, and masterclasses meticulously crafted to propel your learning expedition forward. This immersive bootcamp-style experience boasts interactive lectures, hands-on labs, and collaborative hackathons, all strategically designed to fortify fundamental concepts. Guided by seasoned coaches, each session offers priceless insights and practical skills crucial for honing your expertise. Whether you're stepping into the realm of professional skills or a seasoned professional, this comprehensive course ensures you're equipped with the knowledge and prowess necessary for success. While we feel this is the best course for the DP-080T00 Querying Data with Microsoft Transact-SQL course and one of our Top 10 we encourage you to read the course outline to make sure it is the right content for you. Additionally, private sessions, closed classes or dedicated events are available both live online and at our training centres in Dublin and London, as well as at your offices anywhere in the UK, Ireland or across EMEA.