- Professional Development
- Medicine & Nursing
- Arts & Crafts
- Health & Wellbeing
- Personal Development
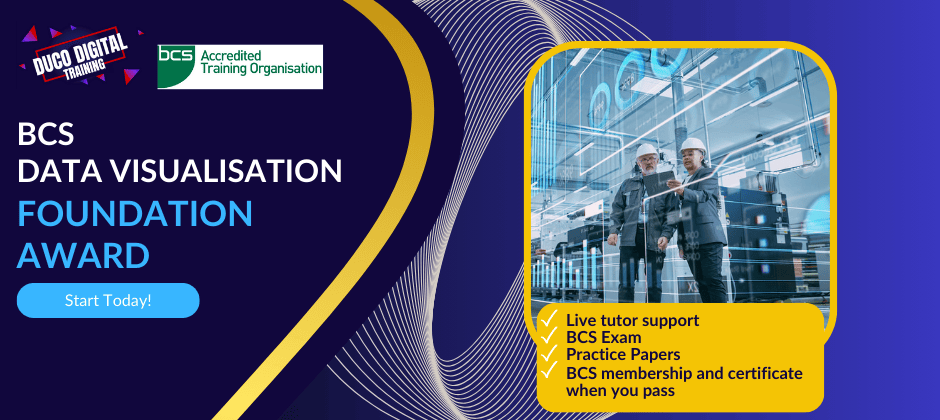
302 Data Visualization courses in Belfast delivered On Demand
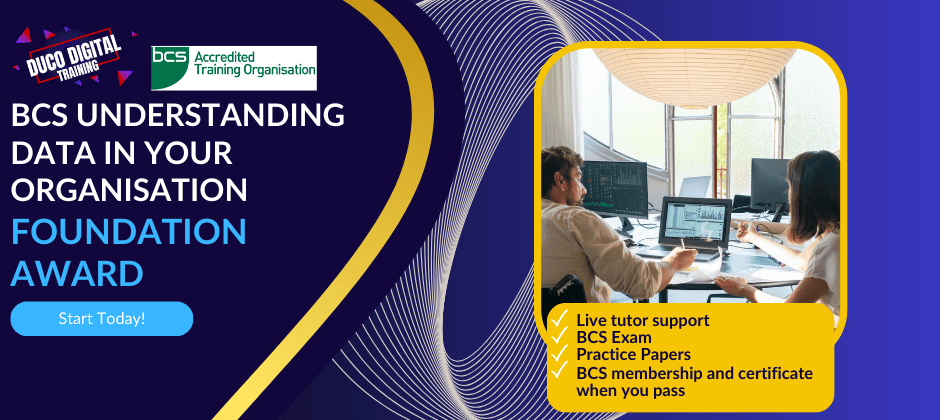
Thinking about learning more understanding the role of data within an organisation? As data becomes an important currency in the world and an enabler for the future, it is imperative that all organisations have a firm understanding of the data available to them and the power it can hold. The BCS Foundation Award in Understanding Data in your Organisation teaches the the terminology, principles, concepts and approaches used within data management, and the overall value of data to an organisation.
Splunk for Beginners: Make the Most of Machine Data Using Splunk
By Packt
In this course, you will learn to create effective visualizations for different stakeholders with the Splunk web framework, utilize tokens and event handlers, explore SDKs, interact with REST APIs, and build a test lab for log analysis and incident response.
Data Analytics Using Python Visualizations
By Packt
If you are working on data science projects and want to create powerful visualization and insights as an outcome of your projects or are working on machine learning projects and want to find patterns and insights from your data on your way to building models, then this course is for you. This course exclusively focuses on explaining how to build fantastic visualizations using Python. It covers more than 20 types of visualizations using the most popular Python visualization libraries, such as Matplotlib, Seaborn, and Bokeh along with data analytics that leads to building these visualizations so that the learners understand the flow of analysis to insights.
Master in Microsoft Power BI Desktop and Service
By Packt
This Microsoft Power BI course will help you become a Power BI expert. It'll enhance your skills by offering you comprehensive knowledge on Power BI Desktop and Power BI Online, and unleash the capabilities of Power BI to perform a comprehensive analysis of data from multiple sources and present the data using the perfect visualization.
Business Intelligence with Microsoft Power BI - with Material
By Packt
This course will take you through the key tools of Power BI. You will learn how to use them to clean and visualize data and create impressive reports and dashboards with ease.

AWS Certified Data Analytics Specialty (2023) Hands-on
By Packt
This course covers the important topics needed to pass the AWS Certified Data Analytics-Specialty exam (AWS DAS-C01). You will learn about Kinesis, EMR, DynamoDB, and Redshift, and get ready for the exam by working through quizzes, exercises, and practice exams, along with exploring essential tips and techniques.
Alteryx for Beginners
By Packt
This course takes you through the concepts of Alteryx from scratch. With the help of interesting case studies, you will learn how to use Alteryx for joining datasets, performing union operations, finding and replacing text, sorting and filtering data, and a lot more.
The Complete Masterclass on PL-900 Certification
By Packt
Prepare for success with the Microsoft PL-900 Certification Course, covering the fundamentals of Power Platform, including Power BI, Power Apps, Power Automate, Power Virtual Agents, and related topics such as Dataverse, AI Builder, Connectors, Dynamics 365, Teams, Security, and Administration. Suitable for beginners with no prerequisites.