- Professional Development
- Medicine & Nursing
- Arts & Crafts
- Health & Wellbeing
- Personal Development
194 Data Skills courses in Coventry delivered Online
Data Warehousing on AWS
By Nexus Human
Duration 3 Days 18 CPD hours This course is intended for This course is intended for: Database architects Database administrators Database developers Data analysts and scientists Overview This course is designed to teach you how to: Discuss the core concepts of data warehousing, and the intersection between data warehousing and big data solutions Launch an Amazon Redshift cluster and use the components, features, and functionality to implement a data warehouse in the cloud Use other AWS data and analytic services, such as Amazon DynamoDB, Amazon EMR, Amazon Kinesis, and Amazon S3, to contribute to the data warehousing solution Architect the data warehouse Identify performance issues, optimize queries, and tune the database for better performance Use Amazon Redshift Spectrum to analyze data directly from an Amazon S3 bucket Use Amazon QuickSight to perform data analysis and visualization tasks against the data warehouse Data Warehousing on AWS introduces you to concepts, strategies, and best practices for designing a cloud-based data warehousing solution using Amazon Redshift, the petabyte-scale data warehouse in AWS. This course demonstrates how to collect, store, and prepare data for the data warehouse by using other AWS services such as Amazon DynamoDB, Amazon EMR, Amazon Kinesis, and Amazon S3. Additionally, this course demonstrates how to use Amazon QuickSight to perform analysis on your data Module 1: Introduction to Data Warehousing Relational databases Data warehousing concepts The intersection of data warehousing and big data Overview of data management in AWS Hands-on lab 1: Introduction to Amazon Redshift Module 2: Introduction to Amazon Redshift Conceptual overview Real-world use cases Hands-on lab 2: Launching an Amazon Redshift cluster Module 3: Launching clusters Building the cluster Connecting to the cluster Controlling access Database security Load data Hands-on lab 3: Optimizing database schemas Module 4: Designing the database schema Schemas and data types Columnar compression Data distribution styles Data sorting methods Module 5: Identifying data sources Data sources overview Amazon S3 Amazon DynamoDB Amazon EMR Amazon Kinesis Data Firehose AWS Lambda Database Loader for Amazon Redshift Hands-on lab 4: Loading real-time data into an Amazon Redshift database Module 6: Loading data Preparing Data Loading data using COPY Data Warehousing on AWS AWS Classroom Training Concurrent write operations Troubleshooting load issues Hands-on lab 5: Loading data with the COPY command Module 7: Writing queries and tuning for performance Amazon Redshift SQL User-Defined Functions (UDFs) Factors that affect query performance The EXPLAIN command and query plans Workload Management (WLM) Hands-on lab 6: Configuring workload management Module 8: Amazon Redshift Spectrum Amazon Redshift Spectrum Configuring data for Amazon Redshift Spectrum Amazon Redshift Spectrum Queries Hands-on lab 7: Using Amazon Redshift Spectrum Module 9: Maintaining clusters Audit logging Performance monitoring Events and notifications Lab 8: Auditing and monitoring clusters Resizing clusters Backing up and restoring clusters Resource tagging and limits and constraints Hands-on lab 9: Backing up, restoring and resizing clusters Module 10: Analyzing and visualizing data Power of visualizations Building dashboards Amazon QuickSight editions and feature

Building Data Analytics Solutions Using Amazon Redshift
By Nexus Human
Duration 1 Days 6 CPD hours This course is intended for This course is intended for data warehouse engineers, data platform engineers, and architects and operators who build and manage data analytics pipelines. Completed either AWS Technical Essentials or Architecting on AWS Completed Building Data Lakes on AWS Overview In this course, you will learn to: Compare the features and benefits of data warehouses, data lakes, and modern data architectures Design and implement a data warehouse analytics solution Identify and apply appropriate techniques, including compression, to optimize data storage Select and deploy appropriate options to ingest, transform, and store data Choose the appropriate instance and node types, clusters, auto scaling, and network topology for a particular business use case Understand how data storage and processing affect the analysis and visualization mechanisms needed to gain actionable business insights Secure data at rest and in transit Monitor analytics workloads to identify and remediate problems Apply cost management best practices In this course, you will build a data analytics solution using Amazon Redshift, a cloud data warehouse service. The course focuses on the data collection, ingestion, cataloging, storage, and processing components of the analytics pipeline. You will learn to integrate Amazon Redshift with a data lake to support both analytics and machine learning workloads. You will also learn to apply security, performance, and cost management best practices to the operation of Amazon Redshift. Module A: Overview of Data Analytics and the Data Pipeline Data analytics use cases Using the data pipeline for analytics Module 1: Using Amazon Redshift in the Data Analytics Pipeline Why Amazon Redshift for data warehousing? Overview of Amazon Redshift Module 2: Introduction to Amazon Redshift Amazon Redshift architecture Interactive Demo 1: Touring the Amazon Redshift console Amazon Redshift features Practice Lab 1: Load and query data in an Amazon Redshift cluster Module 3: Ingestion and Storage Ingestion Interactive Demo 2: Connecting your Amazon Redshift cluster using a Jupyter notebook with Data API Data distribution and storage Interactive Demo 3: Analyzing semi-structured data using the SUPER data type Querying data in Amazon Redshift Practice Lab 2: Data analytics using Amazon Redshift Spectrum Module 4: Processing and Optimizing Data Data transformation Advanced querying Practice Lab 3: Data transformation and querying in Amazon Redshift Resource management Interactive Demo 4: Applying mixed workload management on Amazon Redshift Automation and optimization Interactive demo 5: Amazon Redshift cluster resizing from the dc2.large to ra3.xlplus cluster Module 5: Security and Monitoring of Amazon Redshift Clusters Securing the Amazon Redshift cluster Monitoring and troubleshooting Amazon Redshift clusters Module 6: Designing Data Warehouse Analytics Solutions Data warehouse use case review Activity: Designing a data warehouse analytics workflow Module B: Developing Modern Data Architectures on AWS Modern data architectures
CertNexus Certified Data Science Practitioner (CDSP)
By Nexus Human
Duration 5 Days 30 CPD hours This course is intended for This course is designed for business professionals who leverage data to address business issues. The typical student in this course will have several years of experience with computing technology, including some aptitude in computer programming. However, there is not necessarily a single organizational role that this course targets. A prospective student might be a programmer looking to expand their knowledge of how to guide business decisions by collecting, wrangling, analyzing, and manipulating data through code; or a data analyst with a background in applied math and statistics who wants to take their skills to the next level; or any number of other data-driven situations. Ultimately, the target student is someone who wants to learn how to more effectively extract insights from their work and leverage that insight in addressing business issues, thereby bringing greater value to the business. Overview In this course, you will learn to: Use data science principles to address business issues. Apply the extract, transform, and load (ETL) process to prepare datasets. Use multiple techniques to analyze data and extract valuable insights. Design a machine learning approach to address business issues. Train, tune, and evaluate classification models. Train, tune, and evaluate regression and forecasting models. Train, tune, and evaluate clustering models. Finalize a data science project by presenting models to an audience, putting models into production, and monitoring model performance. For a business to thrive in our data-driven world, it must treat data as one of its most important assets. Data is crucial for understanding where the business is and where it's headed. Not only can data reveal insights, it can also inform?by guiding decisions and influencing day-to-day operations. This calls for a robust workforce of professionals who can analyze, understand, manipulate, and present data within an effective and repeatable process framework. In other words, the business world needs data science practitioners. This course will enable you to bring value to the business by putting data science concepts into practice Addressing Business Issues with Data Science Topic A: Initiate a Data Science Project Topic B: Formulate a Data Science Problem Extracting, Transforming, and Loading Data Topic A: Extract Data Topic B: Transform Data Topic C: Load Data Analyzing Data Topic A: Examine Data Topic B: Explore the Underlying Distribution of Data Topic C: Use Visualizations to Analyze Data Topic D: Preprocess Data Designing a Machine Learning Approach Topic A: Identify Machine Learning Concepts Topic B: Test a Hypothesis Developing Classification Models Topic A: Train and Tune Classification Models Topic B: Evaluate Classification Models Developing Regression Models Topic A: Train and Tune Regression Models Topic B: Evaluate Regression Models Developing Clustering Models Topic A: Train and Tune Clustering Models Topic B: Evaluate Clustering Models Finalizing a Data Science Project Topic A: Communicate Results to Stakeholders Topic B: Demonstrate Models in a Web App Topic C: Implement and Test Production Pipelines
CertNexus Data Science for Business Professionals (DSBIZ)
By Nexus Human
Duration 0.5 Days 3 CPD hours This course is intended for This course is designed for business leaders and decision makers, including C-level executives, project managers, HR leaders, Marketing and Sales leaders, and technical sales consultants, who want to increase their knowledge of and familiarity with concepts surrounding data science. Other individuals who want to know more about basic data science concepts are also candidates for this course. This course is also designed to assist learners in preparing for the CertNexus DSBIZ⢠(Exam DSZ-110) credential. Overview In this course, you will identify how data science supports business decisions. You will: Explain the fundamentals of data science Describe common implementations of data science. Identify the impact data science can have on a business The ability to identify and respond to changing trends is a hallmark of a successful business. Whether those trends are related to customers and sales or to regulatory and industry standards, businesses are wise to keep track of the variables that can affect the bottom line. In today's business landscape, data comes from numerous sources and in diverse forms. By leveraging data science concepts and technologies, businesses can mold all of that raw data into information that facilitates decisions to improve and expand the success of the business. Data Science Fundamentals What is Data Science? Types of Data Data Science Roles Data Science Implementation The Data Science Lifecycle Data Acquisition and Preparation Data Modeling and Visualization The Impact of Data Science Benefits of Data Science Challenges of Data Science Business Use Cases for Data Science Additional course details: Nexus Humans CertNexus Data Science for Business Professionals (DSBIZ) training program is a workshop that presents an invigorating mix of sessions, lessons, and masterclasses meticulously crafted to propel your learning expedition forward. This immersive bootcamp-style experience boasts interactive lectures, hands-on labs, and collaborative hackathons, all strategically designed to fortify fundamental concepts. Guided by seasoned coaches, each session offers priceless insights and practical skills crucial for honing your expertise. Whether you're stepping into the realm of professional skills or a seasoned professional, this comprehensive course ensures you're equipped with the knowledge and prowess necessary for success. While we feel this is the best course for the CertNexus Data Science for Business Professionals (DSBIZ) course and one of our Top 10 we encourage you to read the course outline to make sure it is the right content for you. Additionally, private sessions, closed classes or dedicated events are available both live online and at our training centres in Dublin and London, as well as at your offices anywhere in the UK, Ireland or across EMEA.
Online Options
Show all 194This Data Analyst : Data Analytics Diploma bundle will help you to become a job-ready Data Analyst. The Data Analyst : Data Analytics Diploma course provides complete preparation for someone who aspires to become a data analyst at a minimal cost compared to the typical programs (not to mention how much time you will save). We believe this course will significantly boost your chances of landing your dream job, as it will prepare you for practical tasks and concepts frequently included in interviews. Approximately 3.5 million jobs are there for professionals with data skills. So if you want to broaden your career opportunities, enrol in our Data Analyst : Data Analytics Diploma course, where our industry experts have included every detail of data learning material to give you a clear picture. Don't miss out! We created this Data Analyst : Data Analytics Diploma to prepare you to advance your data analyst career. It is a unique training program because it teaches the fundamentals you need on the job-an often neglected aspect of critical importance. Our tutors will prepare you for a career as a Data Analyst by teaching you the fundamentals of mathematics, statistics, economics, theory analysis, data visualisation, data interpretation, risk management, and many other subjects. Everything is shown in the correct order, and you are not going to get lost along the way. This Data Analyst : Data Analytics Bundle Consists of the following Premium courses: Course 01: Data Analysis Course 02: Data Analytics with Tableau Course 03: Complete Google Analytics Course Course 04: Data Analysis in Excel Level 3 Course Course 05: Business Intelligence and Data Mining Masterclass Course 06: Business Analysis Level 3 Course 07: Information Management Course 08: Clinical Data Analysis with SAS Course 09: Strategic Business Management Course 10: Data Protection and Data Security Level 2 Course 11: Excel: Top 50 Microsoft Excel Formulas in 50 Minutes! Course 12: GDPR Data Protection Level 5 Course 13: Decision-Making and Critical Thinking Course 14: Time Management Enrol now in Data Analyst : Data Analytics to advance your career, and use the premium study materials from Apex Learning. The Data Analyst : Data Analytics bundle incorporates basic to advanced level skills to shed some light on your way and boost your career. Hence, you can strengthen your Data Analyst : Data Analytics expertise and essential knowledge, which will assist you in reaching your goal. Moreover, you can learn from any place in your own time without travelling for classes. Course Curriculum : Course 01: Introduction to Data Analysis Introduction The Voice of the Process Working as One Team for Improvement Exercise: The Voice of the Customer Tools for Data Analysis The Pareto Chart The Histogram The Run Chart Exercise: Presenting Performance Data Understanding Variation The Control Chart Control Chart Example Control Chart Special Cases Interpreting the Control Chart Control Chart Exercise Strategies to Deal with Variation Using Data to Drive Improvement A Structure for Performance Measurement Data Analysis Exercise Course Project Test your Understanding ---------- 13 additional must needed courses------------ Certificate: PDF Certificate: Free (Previously it was £6*11 = £66) Hard Copy Certificate: Free (For The Title Course: Previously it was £10) CPD 150 CPD hours / points Accredited by CPD Quality Standards Who is this course for? If you want to be a Data Analyst or Data Scientist, you should take this course. If you want to have a successful career, this course is for you. The course is also great for beginners because it starts with the basics and gradually builds up your skills. Students who aspire to be among the top 20% of Data Analysts. Students who want to gain hands-on experience with large, interesting datasets. Requirements This Data Analyst : Data Analytics course has been designed to be fully compatible with tablets and smartphones. Career path This Data Analyst : Data Analytics Bundle is ideal for anyone who wants to take their career development to the next level and fast-track their career in any of the following roles: Data analytics manager Financial analyst Marketing analyst Systems analyst Data scientist Data analytics consultant In the UK, these professionals' income ranges from £45,000 to £120,000 per year. Certificates Certificate of completion Digital certificate - Included

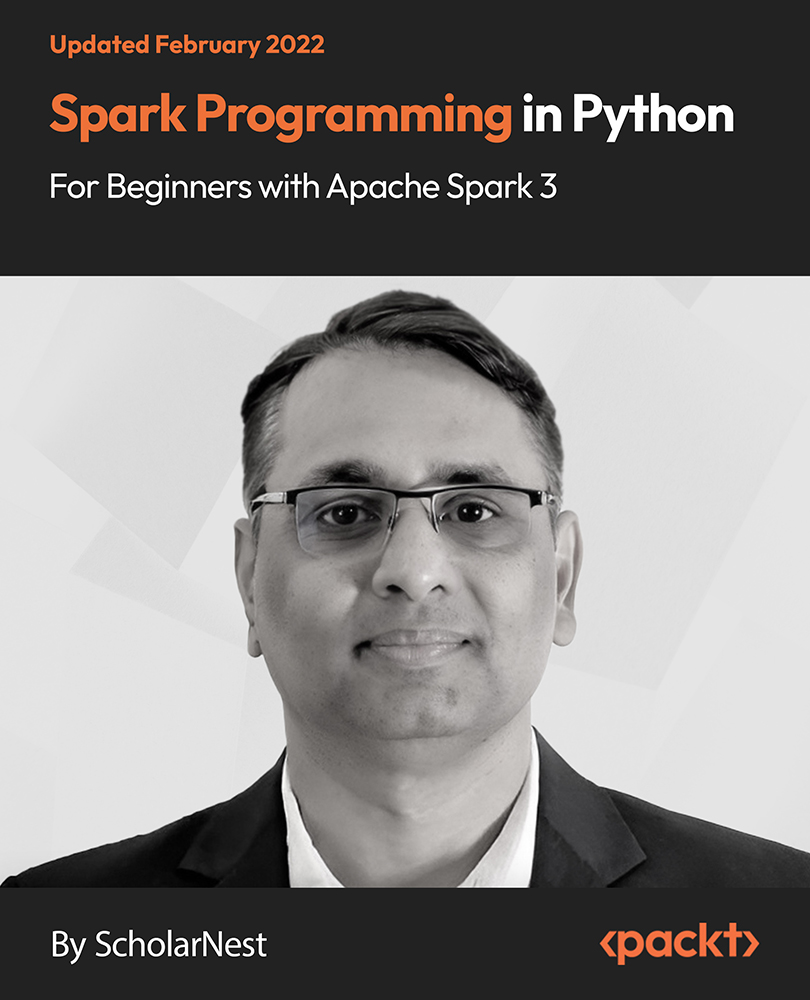
Spark Programming in Python for Beginners with Apache Spark 3
By Packt
Advance your data skills by mastering Spark programming in Python. This beginner's level course will help you understand the core concepts related to Apache Spark 3 and provide you with knowledge of applying those concepts to build data engineering solutions.
Facilities Management: 20-in-1 Premium Online Courses Bundle
By Compete High
Facilities management is more than maintenance—it's strategic, operational, and essential. The Facilities Management: 20-in-1 Premium Online Courses Bundle equips professionals with the cross-functional skills needed in logistics, procurement, operations, and workplace leadership. If you're aiming for roles in property management, estate operations, or support services, this bundle delivers unmatched career leverage. Description In today’s competitive hiring landscape, employers seek more than on-the-ground experience—they want evidence of leadership, data skills, and operational awareness. This comprehensive bundle ticks every box. From supply chain know-how to HR, data handling, and compliance, it brings together everything a future-ready facilities manager should offer. Perfect for those targeting roles in retail property management, warehouse operations, public sector estate services, or large-scale commercial maintenance, this bundle positions you as the complete candidate. For a single, exceptional price, you’ll walk away with 20 individual certifications—each one strengthening your job profile. Secure your place ahead of the queue before demand spikes. FAQ Q: What types of roles does this bundle support? A: Facilities manager, procurement officer, logistics coordinator, operations supervisor, and estate services assistant. Q: Which industries is this suitable for? A: Real estate, construction, manufacturing, retail, logistics, education, and healthcare facilities. Q: Is this bundle beginner-friendly? A: Yes, it's designed for both newcomers and professionals aiming to validate or expand their skill set. Q: Will I receive separate certificates for each course? A: Absolutely. Each completed course comes with a verifiable certification to boost your CV. Q: How long can I access the bundle? A: You’ll receive full access with no expiry. Learn anytime, at your convenience.
55366 Querying Data with Transact-SQL
By Nexus Human
Duration 5 Days 30 CPD hours This course is intended for This course is intended for novice database developers, database administrators, Business Intelligence developers, report creators, and application developers who have an understanding of relational database concepts and have basic Windows navigation skills. Overview Create single table SELECT queries Create multiple table SELECT queries Filter and sort data Insert, update, and delete data Query data using built-in functions Create queries that aggregate data Create subqueries Create queries that use table expressions Use UNION, INTERSECT, and EXCEPT on multiple sets of data Implement window functions in queries Use PIVOT and GROUPING SETS in queries Use stored procedures in queries Add error handling to queries Use transactions in queries This five-day instructor-led course is intended for IT professionals who wish to use the Transact-SQL language to query and configure Microsoft SQL Server. Students are typically database developers and database administrators, but might also be Business Intelligence developers, report creators, or application developers. In this course, students learn how to query single tables, join data from multiple tables, filter and sort data, modify data, use procedures and functions, and implement error handling. Prerequisites Basic understanding of relational databases. Basic Windows knowledge. Module 1: Introduction to Transact-SQL What is Transact-SQL The SELECT statement The WHERE clause Sorting results Calculations CASE expressions Module 2: Joining tables with Transact-SQL The JOIN clause Inner joins Outer joins Self joins and cross joins Module 3: Filtering and sorting results Implement the ORDER BY clause Filter data with the WHERE clause Limit the number of rows returned by a query Implement NULL logic Module 4: SQL Server data types Understand data types Implement string data types Implement temporal data types Module 5: Inserting, updating and deleting data Insert new records Update existing records Delete data Module 6: Using SQL Server functions with Transact-SQL Understand function types in SQL Server Convert data using functions Implement logical functions Work with NULL data using functions Module 7: Aggregating data with Transact-SQL Implement aggregation in SQL Server Group records in SQL Server Filter aggregated data Module 8: Implement subqueries with Transact-SQL Implement scalar and multi-valued sub-queries Implement correlated subqueries Implement existence checks with subqueries Module 9: Create queries that use table expressions Create views Create table-valued functions Implement derived tables Implement common table expressions Module 10: Use UNION, INTERSECT, EXCEPT and APPLY on multiple sets of data Write queries with the UNION operator Write queries with the INTERSECT and EXCEPT operators Write queries with the APPLY operator Module 11: Implement window functions in queries Understand window functions Impement window functions Module 12: Use PIVOT and grouping sets in queries Implement PIVOT in queries Implement grouping sets in queries Module 13: Use stored procedures in queries Query data with stored procedures Interact with stored procedures using input and output parameters Write simple stored procedures Pass dynamic SQL to SQL Server Module 14: Implement programming features in Transact-SQL Understand T-SQL programming elements Implement loops and conditions in T-SQL queries Module 15: Add error handling to queries Understand SQL Server error handling Implemet structured exception handling Module 16: Use transactions in queries Understand database transactions Implement transactions in T-SQL
IT Support Analyst: 20-in-1 Premium Online Courses Bundle
By Compete High
Analytical thinking meets IT precision. This IT Support Analyst 20-in-1 bundle is tailored for aspiring professionals who want to position themselves as go-to problem-solvers across digital teams. Whether you're stepping into your first analyst role or pivoting from general admin to IT support, this bundle was built to raise your career ceiling. You won’t just fit in—you’ll stand out. 📘 Description Support analysts sit at the critical junction of data, systems, and decision-making. This course collection has been engineered to deliver a well-rounded toolkit that resonates with the needs of hiring managers across IT, finance, HR, and beyond. The diversity of skills means you’ll be able to apply for a wide range of roles without being pigeonholed. And because this bundle covers technical know-how and communication finesse, you’ll be ready for both the hands-on tasks and the people-facing moments. What you gain isn’t just knowledge—it’s career agility. With 20 essential topics under your belt, you're building a résumé that recruiters can’t ignore. The smart move? Start before the next vacancy goes live. ❓ FAQ Q: Is this suitable for people moving into data-heavy roles? A: Absolutely. It's particularly useful for support analysts who need to blend data skills with core IT understanding. Q: Which industries will value this bundle? A: Tech, finance, healthcare, logistics, public services—anywhere digital infrastructure needs reliable support analysis. Q: Will this help me progress to mid-level roles faster? A: It gives you a competitive edge. You’ll show broader skills than most early-career applicants. Q: Is this bundle flexible for remote work roles? A: Yes, the competencies covered are ideal for both in-house and remote support roles. Q: How soon can I start applying for jobs after completing it? A: Many learners begin applying after finishing just a few key courses—don’t wait to be perfect to get started.
CompTIA Data+
By Nexus Human
Duration 5 Days 30 CPD hours Overview Mining data Manipulating data Visualizing and reporting data Applying basic statistical methods Analyzing complex datasets while adhering to governance and quality standards throughout the entire data life cycle CompTIA Data+ is an early-career data analytics certification for professionals tasked with developing and promoting data-driven business decision-making. CompTIA Data+ gives you the confidence to bring data analysis to life. As the importance for data analytics grows, more job roles are required to set context and better communicate vital business intelligence. Collecting, analyzing, and reporting on data can drive priorities and lead business decision-making. 1 - Identifying Basic Concepts of Data Schemas Identify Relational and Non-Relational Databases Understand the Way We Use Tables, Primary Keys, and Normalization 2 - Understanding Different Data Systems Describe Types of Data Processing and Storage Systems Explain How Data Changes 3 - Understanding Types and Characteristics of Data Understand Types of Data Break Down the Field Data Types 4 - Comparing and Contrasting Different Data Structures, Formats, and Markup Languages Differentiate between Structured Data and Unstructured Data Recognize Different File Formats Understand the Different Code Languages Used for Data 5 - Explaining Data Integration and Collection Methods Understand the Processes of Extracting, Transforming, and Loading Data Explain API/Web Scraping and Other Collection Methods Collect and Use Public and Publicly-Available Data Use and Collect Survey Data 6 - Identifying Common Reasons for Cleansing and Profiling Data Learn to Profile Data Address Redundant, Duplicated, and Unnecessary Data Work with Missing Value Address Invalid Data Convert Data to Meet Specifications 7 - Executing Different Data Manipulation Techniques Manipulate Field Data and Create Variables Transpose and Append Data Query Data 8 - Explaining Common Techniques for Data Manipulation and Optimization Use Functions to Manipulate Data Use Common Techniques for Query Optimization 9 - Applying Descriptive Statistical Methods Use Measures of Central Tendency Use Measures of Dispersion Use Frequency and Percentages 10 - Describing Key Analysis Techniques Get Started with Analysis Recognize Types of Analysis 11 - Understanding the Use of Different Statistical Methods Understand the Importance of Statistical Tests Break Down the Hypothesis Test Understand Tests and Methods to Determine Relationships Between Variables 12 - Using the Appropriate Type of Visualization Use Basic Visuals Build Advanced Visuals Build Maps with Geographical Data Use Visuals to Tell a Story 13 - Expressing Business Requirements in a Report Format Consider Audience Needs When Developing a Report Describe Data Source Considerations For Reporting Describe Considerations for Delivering Reports and Dashboards Develop Reports or Dashboards Understand Ways to Sort and Filter Data 14 - Designing Components for Reports and Dashboards Design Elements for Reports and Dashboards Utilize Standard Elements Creating a Narrative and Other Written Elements Understand Deployment Considerations 15 - Understand Deployment Considerations Understand How Updates and Timing Affect Reporting Differentiate Between Types of Reports 16 - Summarizing the Importance of Data Governance Define Data Governance Understand Access Requirements and Policies Understand Security Requirements Understand Entity Relationship Requirements 17 - Applying Quality Control to Data Describe Characteristics, Rules, and Metrics of Data Quality Identify Reasons to Quality Check Data and Methods of Data Validation 18 - Explaining Master Data Management Concepts Explain the Basics of Master Data Management Describe Master Data Management Processes Additional course details: Nexus Humans CompTIA Data Plus (DA0-001) training program is a workshop that presents an invigorating mix of sessions, lessons, and masterclasses meticulously crafted to propel your learning expedition forward. This immersive bootcamp-style experience boasts interactive lectures, hands-on labs, and collaborative hackathons, all strategically designed to fortify fundamental concepts. Guided by seasoned coaches, each session offers priceless insights and practical skills crucial for honing your expertise. Whether you're stepping into the realm of professional skills or a seasoned professional, this comprehensive course ensures you're equipped with the knowledge and prowess necessary for success. While we feel this is the best course for the CompTIA Data Plus (DA0-001) course and one of our Top 10 we encourage you to read the course outline to make sure it is the right content for you. Additionally, private sessions, closed classes or dedicated events are available both live online and at our training centres in Dublin and London, as well as at your offices anywhere in the UK, Ireland or across EMEA.
Radiography: 8 in 1 Premium Courses Bundle
By Compete High
This Radiography 8-in-1 bundle takes a methodical approach to essential supporting knowledge for the radiography field. With no lab coats required, it focuses on anatomy, data handling, reporting, and communication—delivered in a clear, structured format. From understanding the human body to grasping key regulations like GDPR, this bundle also covers first aid essentials, sports injury response, and how to log and present data clearly. Radiography isn’t just about images—it’s about the context behind them. Learning Outcomes: Understand human anatomy relevant to radiographic processes. Apply basic first aid and sports injury response knowledge. Manage personal data with GDPR awareness and care. Log and present medical or clinical data accurately. Communicate clearly in healthcare and administrative settings. Write structured and compliant reports in a medical context. Who is this Course For: Students interested in healthcare or radiography fields. Support staff handling data or documentation in radiology. Healthcare assistants brushing up anatomy and reporting basics. Sports coaches needing injury response awareness. Admins dealing with patient records and reporting. Professionals updating GDPR knowledge in healthcare roles. Allied health staff improving communication and data skills. Career changers exploring entry-level healthcare theory. Career Path: Radiography Assistant – £20,000–£26,000 per year Medical Administrator – £22,000–£28,000 per year Healthcare Support Worker – £21,000–£25,000 per year Sports Injury Assistant – £20,000–£27,000 per year Medical Records Clerk – £21,000–£26,000 per year GDPR Officer (NHS) – £30,000–£42,000 per year

Dashboard design
By Fire Plus Algebra
Data dashboards provide key information to stakeholders so that they can make informed decisions. While there are plenty of software solutions for building these essential data products, there is much less guidance on how to design dashboards to meet the diverse needs of users. This course is for anyone who is building or implementing dashboards, and wants to know more about design principles and best practice. You could be using business intelligence software (such as Power BI or Tableau), or implementing bespoke solutions. The course will give your team the ability to evaluate user needs and levels of understanding, make informed decisions about chart selections, and make effective use of interactivity dynamic data. We’ll work with you before the course to ensure that we understand your organisation and what you’re hoping to achieve. Sample learning content Session 1: Data with a purpose Understanding the different types of dashboard. Information overload and other common dashboard pitfalls. Assessing user needs and levels of data fluency. Session 2: Planning a dashboard Assessing diverse user needs and levels of data fluency. Taking a User Experience (UX) approach to design and navigation. Applying an interative and collaborative approach to onboarding. Session 3: Graphs, charts and dials Understanding how graphical perception informs chart choices. Making intelligent design choices to help users explore. Design principles for layout and navigation. Session 4: Using interactivity Making effective use of filters to slice and dice data sets. Using layers of information to enable drilldown data exploration. Complenting dashboards with automated alerts and queries. Delivery We deliver our courses over Zoom, to maximise flexibility. The training can be delivered in a single day, or across multiple sessions. All of our courses are live and interactive – every session includes a mix of formal tuition and hands-on exercises. To ensure this is possible, the number of attendees is capped at 16 people. Tutor Alan Rutter is the founder of Fire Plus Algebra. He is a specialist in communicating complex subjects through data visualisation, writing and design. He teaches for General Assembly and runs in-house training for public sector clients including the Home Office, the Department of Transport, the Biotechnology and Biological Sciences Research Council, the Health Foundation, and numerous local government and emergency services teams. He previously worked with Guardian Masterclasses on curating and delivering new course strands, including developing and teaching their B2B data visualisation courses. He oversaw the iPad edition launches of Wired, GQ, Vanity Fair and Vogue in the UK, and has worked with Condé Nast International as product owner on a bespoke digital asset management system for their 11 global markets. Testimonial “Alan was great to work with, he took us through the concepts behind data visualisation which means our team is now equipped for the future. He has a wide range of experience across the topic that is delivered in a clear, concise and friendly manner. We look forward to working with Alan again in the future.” John Masterson | Chief Product Officer | ImproveWell

Data Science: 8 in 1 Premium Courses Bundle
By Compete High
Data doesn’t lie—but interpreting it well takes skill. This Data Science 8-in-1 Premium Courses Bundle offers structured guidance on handling, visualising, and interpreting data using industry-relevant tools like Excel, Power BI, SQL, and Python. Whether you’re a curious beginner or improving your analytics know-how, this course is built to speak your language (and code). It doesn’t stop at software either—you’ll also explore communication, GDPR considerations, and how to share findings clearly. No fluff, no mystery—just data done properly, and explained in plain terms. Ideal for those who like facts with fewer frills. Learning Outcomes: Analyse data using Python, Excel, and Power BI. Write and interpret basic SQL queries and statements. Apply data protection rules in line with GDPR principles. Communicate data insights clearly and without jargon. Build simple dashboards and reports from datasets. Understand basic structures in data science pipelines. Who is this Course For: Beginners exploring data science tools and concepts. Admins handling spreadsheets and databases daily. Analysts wanting to refresh their data software skills. IT staff supporting data-driven teams or processes. Career changers moving into technical data fields. Business professionals working with reports and metrics. Entrepreneurs reviewing sales, traffic, or operations data. Students building a portfolio of software-based data skills. Career Path: Junior Data Analyst – £28,000–£35,000 per year Business Intelligence Assistant – £30,000–£40,000 per year SQL Analyst – £32,000–£42,000 per year Excel Reporting Specialist – £25,000–£34,000 per year Python Developer (Data Focus) – £35,000–£48,000 per year Power BI Technician – £30,000–£45,000 per year