- Professional Development
- Medicine & Nursing
- Arts & Crafts
- Health & Wellbeing
- Personal Development
70 Data Modeling courses in Coventry delivered Online
Salesforce Platform App Builder Certification Training
By Packt
Kickstart your career with this Salesforce Platform App Builder Certification program. Salesforce skills are in high demand, and you can learn the core concepts of online application development using Salesforce App Builder and Force.com Platform Fundamentals.
DP-900T00 Microsoft Azure Data Fundamentals
By Nexus Human
Duration 1 Days 6 CPD hours This course is intended for The audience for this course is individuals who want to learn the fundamentals of database concepts in a cloud environment, get basic skilling in cloud data services, and build their foundational knowledge of cloud data services within Microsoft Azure. Overview Describe core data concepts Identify considerations for relational data on Azure Describe considerations for working with non-relational data on Azure Describe an analytics workload on Azure In this course, students will gain foundational knowledge of core data concepts and related Microsoft Azure data services. Students will learn about core data concepts such as relational, non-relational, big data, and analytics, and build their foundational knowledge of cloud data services within Microsoft Azure. Students will explore fundamental relational data concepts and relational database services in Azure. They will explore Azure storage for non-relational data and the fundamentals of Azure Cosmos DB. Students will learn about large-scale data warehousing, real-time analytics, and data visualization. 1 - Explore core data concepts Identify data formats Explore file storage Explore databases Explore transactional data processing Explore analytical data processing 2 - Explore data roles and services Explore job roles in the world of data Identify data services 3 - Explore fundamental relational data concepts Understand relational data Understand normalization Explore SQL Describe database objects 4 - Explore relational database services in Azure Describe Azure SQL services and capabilities Describe Azure services for open-source databases 5 - Explore Azure Storage for non-relational data Explore Azure blob storage Explore Azure DataLake Storage Gen2 Explore Azure Files Explore Azure Tables 6 - Explore fundamentals of Azure Cosmos DB Describe Azure Cosmos DB Identify Azure Cosmos DB APIs 7 - Explore fundamentals of large-scale data warehousing Describe data warehousing architecture Explore data ingestion pipelines Explore analytical data stores 8 - Explore fundamentals of real-time analytics Understand batch and stream processing Explore common elements of stream processing architecture Explore Azure Stream Analytics Explore Apache Spark on Microsoft Azure 9 - Explore fundamentals of data visualization Describe Power BI tools and workflow Describe core concepts of data modeling Describe considerations for data visualization

BW362 SAP BW on SAP HANA
By Nexus Human
Duration 5 Days 30 CPD hours This course is intended for Technology Consultants Overview Enables you to implement and maintain SAP BW powered by SAP HANA.Outlines advantages of the new SAP 'In-Memory' database foundation for SAP BW.Explains HANA specific features as well as optimized existing as well as new data models and functions of SAP BW.Introduces the new SAP architecture framework of LSA++ and provides guidelines on how to convert your existing EDW-architecture into this new concept.Explains native HANA modeling and how both, HANA information views as well as BW InfoProviders, can complement each other in so-called 'mixed scenarios'. In this course, students gain the knowledge to enable themselves to implement and maintain SAP BW powered by SAP HANA. The course explains HANA specific features as well as optimized existing as well as new data models and functions of SAP BW. Getting Started SAP HANA Basics SAP BW Basics SAP HANA BW Modeling Tools SAP HANA Native Modeling Migration to SAP BW on HANA Migration Strategies and Tools SAP BW Migration Cockpit BW on HANA Data Management Multi-Temperature Data Management Optimizing BW Data Management based on Dynamic Tiering and Non- Active Concept Optimizing BW Data Management based on Nearline-Storage Optimization Areas in BW on HANA HANA-Optimized Data Modeling: InfoCubes HANA-Optimized Data Modeling: Advanced DataStore-Objects HANA-Optimized Data Modeling: CompositeProviders HANA-Optimized Data Staging HANA-Optimized Analytic Manager HANA-Optimized Analysis Processes Modeling with SAPïs Reference Architecture LSA++ Review of Layered Scalable Architecture (LSA) From LSA to LSA++: Streamline Core Layers LSA++: Open Operational Data Store Layer (Open ODS Views) LSA++: Agile Data Mart & BW Workspace Layer Hybrid Modeling in Mixed Scenarios Generation of HANA-Views of BW InfoProviders Mixed Scenarios SAP HANA Live HANA-Optimized BI Content Data Provisioning into SAP HANA and SAP BW Overview of Data Provisioning Methods to SAP HANA SLT Replication into SAP HANA SLT Replication into SAP BW Operational Data Provisioning into SAP BW DB-Connect and Open Hub Destination Additional Enhancements of BW 7.40 InfoObject Enhancements Authorization Enhancements Process Chain Monitoring HANA-Optimized BW Search HANA-Optimized BW Planning Obsolete BW Object Types Mobile Enablement Enhancements SAP HANA vs. BW Accelerator Summary & Outlook New Transactions and BW on HANA Roadmap Additional course details: Nexus Humans BW362 SAP BW on SAP HANA training program is a workshop that presents an invigorating mix of sessions, lessons, and masterclasses meticulously crafted to propel your learning expedition forward. This immersive bootcamp-style experience boasts interactive lectures, hands-on labs, and collaborative hackathons, all strategically designed to fortify fundamental concepts. Guided by seasoned coaches, each session offers priceless insights and practical skills crucial for honing your expertise. Whether you're stepping into the realm of professional skills or a seasoned professional, this comprehensive course ensures you're equipped with the knowledge and prowess necessary for success. While we feel this is the best course for the BW362 SAP BW on SAP HANA course and one of our Top 10 we encourage you to read the course outline to make sure it is the right content for you. Additionally, private sessions, closed classes or dedicated events are available both live online and at our training centres in Dublin and London, as well as at your offices anywhere in the UK, Ireland or across EMEA.
Looker Bootcamp: Analyzing and Visualizing Data with Looker (TTDVLK02)
By Nexus Human
Duration 2 Days 12 CPD hours This course is intended for The audience for this course includes professionals who are new to Looker who are interested in leveraging Looker for data analysis, visualization, and reporting. The course is designed for individuals seeking to gain a comprehensive understanding of Looker's functionalities and apply these skills in their organizations to drive data-driven decision-making. Overview This course combines expert lecture, real-world demonstrations and group discussions with machine-based practical labs and exercises. Working in a hands-on learning environment led by our expert facilitator, you'll explore and gain: Comprehensive understanding of Looker's platform: Gain a solid foundation in Looker's key features, functionality, and interface, enabling you to navigate and utilize the platform effectively for your data analysis and visualization needs. Mastery of LookML and data modeling: Develop proficiency in Looker's unique data modeling language, LookML, to create customized and efficient data models that cater to your organization's specific requirements. Expertise in creating insightful Explores: Learn to build, customize, and save Explores with dimensions, measures, filters, and calculated fields, empowering you to analyze your data and uncover valuable insights. Proficiency in dashboard design and sharing: Acquire the skills to design visually appealing and informative dashboards, share them with different user roles, and schedule exports to keep stakeholders informed and up-to-date. Enhanced content organization with folders and boards: Understand how to effectively use folders and boards to organize, manage, and discover content within Looker, making it easily accessible for you and your team. Optional: Advanced visualization techniques for impactful storytelling: Master advanced visualization techniques, including customizations with HTML, CSS, and JavaScript, and interactive visualizations using Looker's API, to create compelling data stories that resonate with your audience. Discover the power of data analytics and visualization with our hands-on, two-day introductory course Looker Bootcamp: Analyzing and Visualizing Data with Looker. Designed for professionals who want to unlock valuable insights from their data, this immersive training experience will guide you through Looker's cutting-edge features and provide you with the essential skills to create engaging, interactive, and insightful reports and dashboards. Our experienced trainers will take you on a journey from the fundamentals of Looker and its unique data modeling language, LookML, to advanced visualization techniques and content organization strategies, ensuring you leave the course equipped to make data-driven decisions with confidence. Throughout the course, you will have the opportunity to participate in practical exercises and workshops that will help you apply the concepts and techniques learned in real-world scenarios. You will explore the potential of Looker's Explores, dive into LookML's capabilities, and master the art of dashboard design and sharing. Learn how to organize and manage your content with folders and boards and harness the power of advanced visualization techniques to make your data come alive. Getting Started with Looker Overview of Looker and its key features Navigating the Looker interface Looker terminology and basic concepts Connecting to Data Sources Setting up and managing data connections Exploring database schemas Understanding LookML: Looker's data modeling language Creating and Customizing Explores Building and customizing Explores Adding dimensions, measures, and filters Creating calculated fields Saving and organizing Explores Data Visualization Creating visualizations using Looker's visualization library Customizing chart types, colors, and labels Displaying visualizations in dashboards Introduction to Looker's API for custom visualizations Advanced Explores and LookML LookML refresher and best practices Creating derived tables and data transformations Managing access controls and data permissions Organizing and Sharing Content with Folders and Boards Introduction to folders and boards in Looker Creating and managing folders for organizing content Setting up boards for easy content discovery Sharing folders and boards with different user roles and permissions Dashboard Design and Sharing Best practices for dashboard design Adding, arranging, and resizing visualizations Scheduling and exporting dashboard data Advanced Visualization Techniques Customizing visualizations with HTML, CSS, and JavaScript Creating interactive visualizations using Looker's API Integrating Looker visualizations with other tools Hands-on Workshop and Project Participants work on a guided project to apply the skills learned Trainer provides individual support and guidance Project Presentations, Q&A, and Training Wrap-up Additional course details: Nexus Humans Looker Bootcamp: Analyzing and Visualizing Data with Looker (TTDVLK02) training program is a workshop that presents an invigorating mix of sessions, lessons, and masterclasses meticulously crafted to propel your learning expedition forward. This immersive bootcamp-style experience boasts interactive lectures, hands-on labs, and collaborative hackathons, all strategically designed to fortify fundamental concepts. Guided by seasoned coaches, each session offers priceless insights and practical skills crucial for honing your expertise. Whether you're stepping into the realm of professional skills or a seasoned professional, this comprehensive course ensures you're equipped with the knowledge and prowess necessary for success. While we feel this is the best course for the Looker Bootcamp: Analyzing and Visualizing Data with Looker (TTDVLK02) course and one of our Top 10 we encourage you to read the course outline to make sure it is the right content for you. Additionally, private sessions, closed classes or dedicated events are available both live online and at our training centres in Dublin and London, as well as at your offices anywhere in the UK, Ireland or across EMEA.

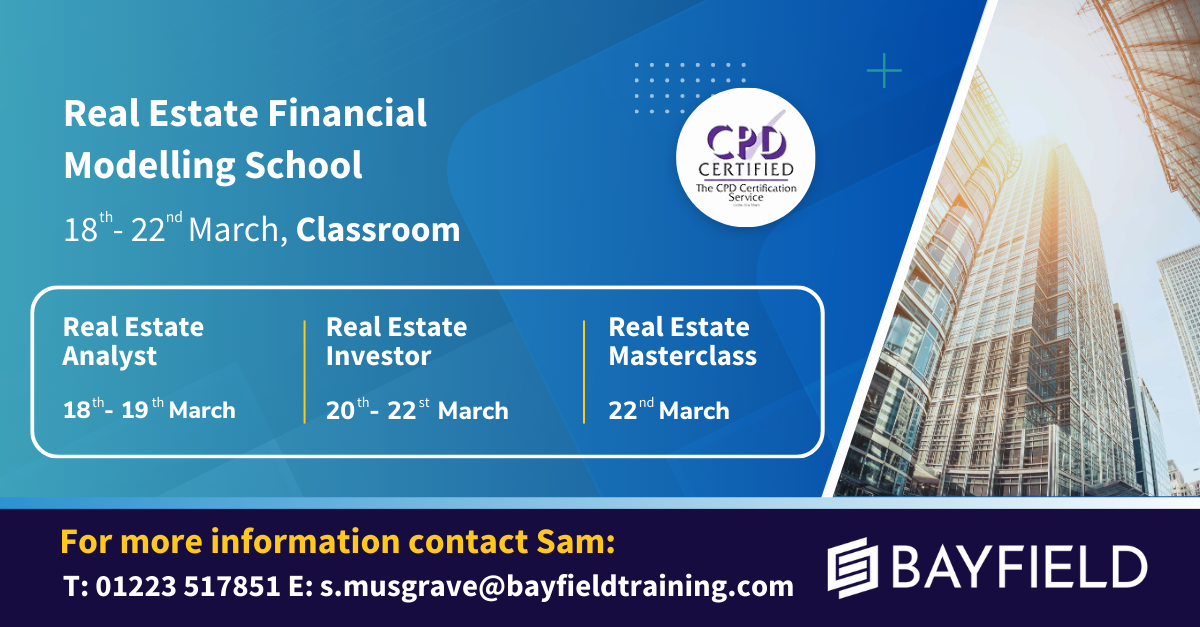
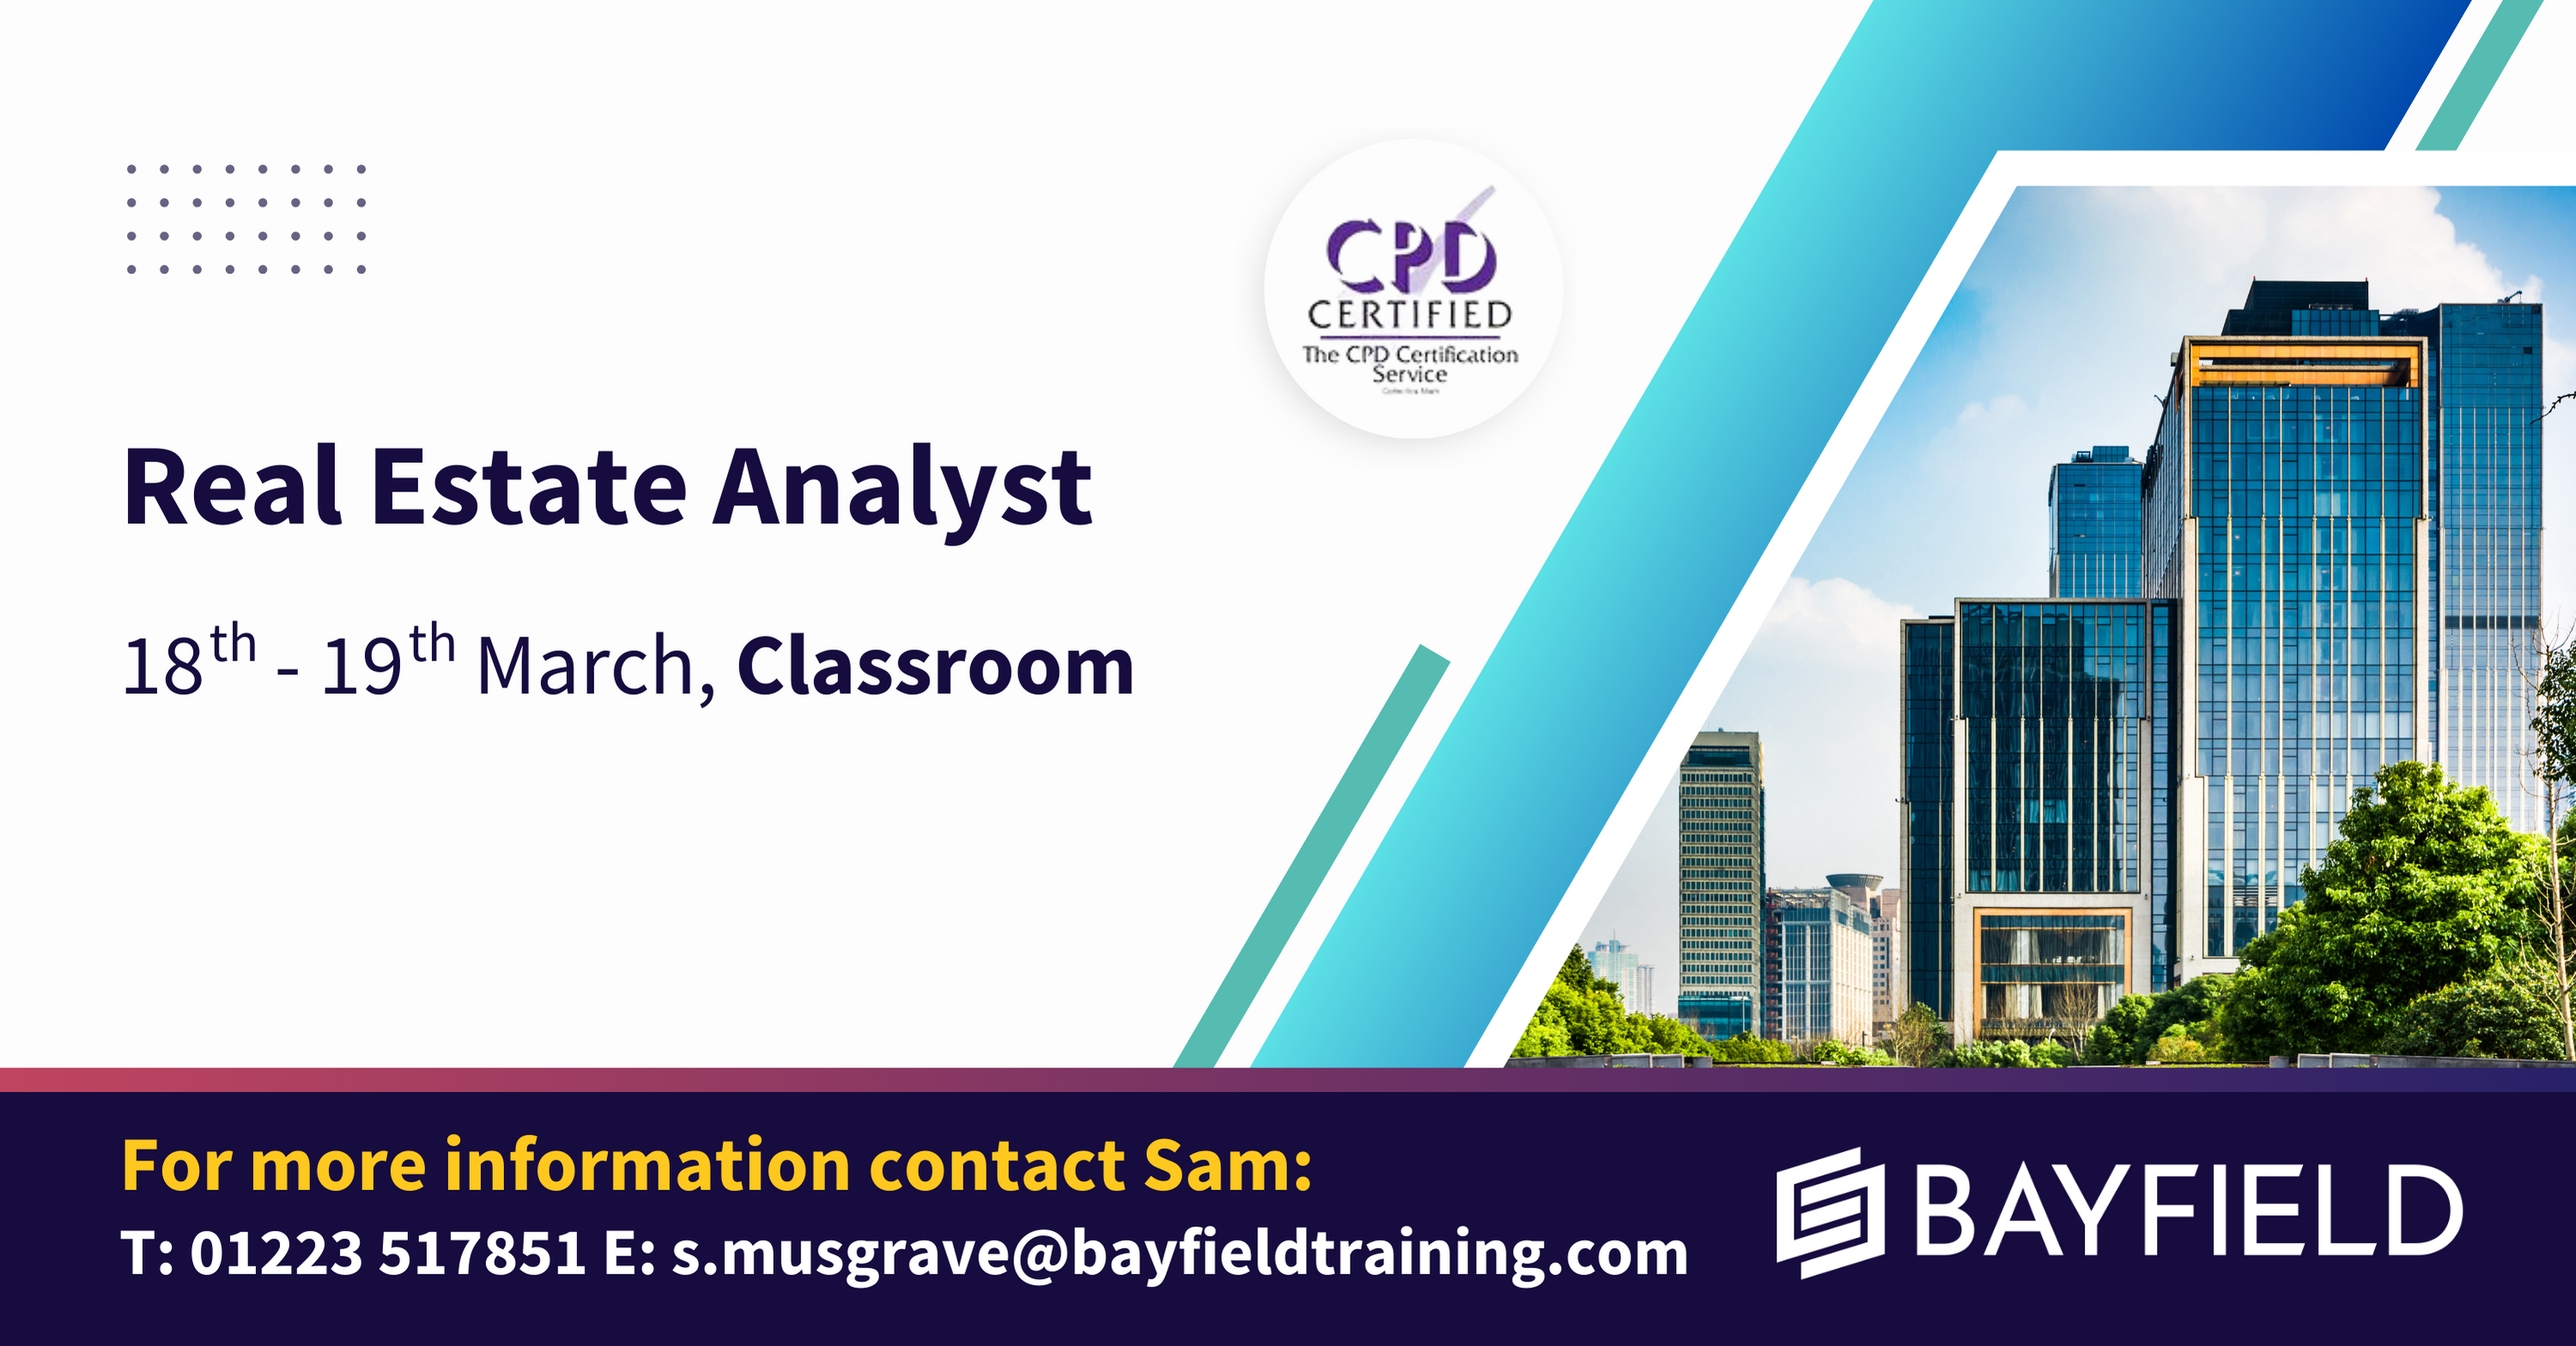
The Real Estate Analyst course has been taught non-stop to global real estate firms over the last 25 years, and is without doubt the core financial modelling training in your career portfolio. Whether you have an upcoming financial modelling test for a new job or an APC exam, the Real Estate Analyst course is the choice for you.
Power BI Masterclass 8 -Python, Finance, and Advanced DAX
By Packt
This comprehensive training program covers many concepts in Microsoft Power BI. From beginner to advanced levels, learn data visualization, advanced DAX expression, Python integration, custom visuals, data preparation, and collaboration in Power BI service. Develop expertise in Power BI and position yourself for a successful career in data analytics.
Looker Basics: Quick Start to Analyzing and Visualizing Data using Looker (TTDVLK01)
By Nexus Human
Duration 1 Days 6 CPD hours This course is intended for The audience for this course includes professionals who are new to Looker who are interested in leveraging Looker for data analysis, visualization, and reporting. The course is designed for individuals seeking to gain a comprehensive understanding of Looker's functionalities and apply these skills in their organizations to drive data-driven decision-making. Overview Working in a hands-on learning environment led by our expert facilitator, you'll explore and gain: Solid foundation in Looker's platform: Acquire a comprehensive understanding of Looker's key features, functionality, and interface, enabling you to effectively utilize the platform for your data analysis and visualization needs. Proficiency in LookML and data modeling: Develop essential skills in Looker's unique data modeling language, LookML, to create efficient and customized data models tailored to your organization's specific requirements. Expertise in creating Explores: Learn how to build, customize, and save Explores with dimensions, measures, filters, and calculated fields, empowering you to analyze your data and uncover valuable insights in a short amount of time. Mastery of dashboard design and visualization: Gain the skills to design visually appealing and informative dashboards, create various types of visualizations, and customize them to effectively communicate your data story. Improved content organization with folders and boards: Understand how to effectively use folders and boards in Looker to organize, manage, and discover content, making your data insights easily accessible for you and your team. Looker Basics: Quick Start to Analyzing and Visualizing Data using Looker is a one day, hands-on course designed to equip professionals from a variety of backgrounds with the knowledge and skills needed to harness the full potential of their data using Looker's powerful platform. With the guidance of our expert trainers, you will gain a basic understanding of Looker's features, enabling you to create visually engaging, interactive, and insightful reports and dashboards to drive informed decision-making. Throughout this interactive workshop, you will explore Looker's key functionalities, including connecting to data sources, mastering LookML, building custom Explores, and designing captivating dashboards. With about 40% of the course dedicated to hands-on labs and a guided project, you will have ample opportunity to apply the skills you've learned in real world scenarios. Don't miss this opportunity to elevate your data analysis and visualization capabilities, enhance your professional skill set, and unlock the power of data-driven decision making. Getting Started with Looker Overview of Looker and its key features Navigating the Looker interface Connecting to Data Sources and LookML Basics Setting up and managing data connections Exploring database schemas Understanding LookML: Looker's data modeling language Creating and Customizing Explores Building and customizing Explores Adding dimensions, measures, and filters Creating calculated fields Data Visualization and Dashboard Design Creating visualizations using Looker's visualization library Customizing chart types, colors, and labels Displaying visualizations in dashboards Organizing Content with Folders and Boards Introduction to folders and boards in Looker Creating and managing folders for organizing content Setting up boards for easy content discovery Hands-on Workshop and Project Participants work on a guided project to apply the skills learned Wrap-up and Q&A Additional course details: Nexus Humans Looker Basics: Quick Start to Analyzing and Visualizing Data using Looker (TTDVLK01) training program is a workshop that presents an invigorating mix of sessions, lessons, and masterclasses meticulously crafted to propel your learning expedition forward. This immersive bootcamp-style experience boasts interactive lectures, hands-on labs, and collaborative hackathons, all strategically designed to fortify fundamental concepts. Guided by seasoned coaches, each session offers priceless insights and practical skills crucial for honing your expertise. Whether you're stepping into the realm of professional skills or a seasoned professional, this comprehensive course ensures you're equipped with the knowledge and prowess necessary for success. While we feel this is the best course for the Looker Basics: Quick Start to Analyzing and Visualizing Data using Looker (TTDVLK01) course and one of our Top 10 we encourage you to read the course outline to make sure it is the right content for you. Additionally, private sessions, closed classes or dedicated events are available both live online and at our training centres in Dublin and London, as well as at your offices anywhere in the UK, Ireland or across EMEA.
DP-601T00 Implementing a Lakehouse with Microsoft Fabric
By Nexus Human
Duration 1 Days 6 CPD hours This course is intended for The primary audience for this course is data professionals who are familiar with data modeling, extraction, and analytics. It is designed for professionals who are interested in gaining knowledge about Lakehouse architecture, the Microsoft Fabric platform, and how to enable end-to-end analytics using these technologies. Job role: Data Analyst, Data Engineer, Data Scientist Overview Describe end-to-end analytics in Microsoft Fabric Describe core features and capabilities of lakehouses in Microsoft Fabric Create a lakehouse Ingest data into files and tables in a lakehouse Query lakehouse tables with SQL Configure Spark in a Microsoft Fabric workspace Identify suitable scenarios for Spark notebooks and Spark jobs Use Spark dataframes to analyze and transform data Use Spark SQL to query data in tables and views Visualize data in a Spark notebook Understand Delta Lake and delta tables in Microsoft Fabric Create and manage delta tables using Spark Use Spark to query and transform data in delta tables Use delta tables with Spark structured streaming Describe Dataflow (Gen2) capabilities in Microsoft Fabric Create Dataflow (Gen2) solutions to ingest and transform data Include a Dataflow (Gen2) in a pipeline This course is designed to build your foundational skills in data engineering on Microsoft Fabric, focusing on the Lakehouse concept. This course will explore the powerful capabilities of Apache Spark for distributed data processing and the essential techniques for efficient data management, versioning, and reliability by working with Delta Lake tables. This course will also explore data ingestion and orchestration using Dataflows Gen2 and Data Factory pipelines. This course includes a combination of lectures and hands-on exercises that will prepare you to work with lakehouses in Microsoft Fabric. Introduction to end-to-end analytics using Microsoft Fabric Explore end-to-end analytics with Microsoft Fabric Data teams and Microsoft Fabric Enable and use Microsoft Fabric Knowledge Check Get started with lakehouses in Microsoft Fabric Explore the Microsoft Fabric Lakehouse Work with Microsoft Fabric Lakehouses Exercise - Create and ingest data with a Microsoft Fabric Lakehouse Use Apache Spark in Microsoft Fabric Prepare to use Apache Spark Run Spark code Work with data in a Spark dataframe Work with data using Spark SQL Visualize data in a Spark notebook Exercise - Analyze data with Apache Spark Work with Delta Lake Tables in Microsoft Fabric Understand Delta Lake Create delta tables Work with delta tables in Spark Use delta tables with streaming data Exercise - Use delta tables in Apache Spark Ingest Data with DataFlows Gen2 in Microsoft Fabric Understand Dataflows (Gen2) in Microsoft Fabric Explore Dataflows (Gen2) in Microsoft Fabric Integrate Dataflows (Gen2) and Pipelines in Microsoft Fabric Exercise - Create and use a Dataflow (Gen2) in Microsoft Fabric