- Professional Development
- Medicine & Nursing
- Arts & Crafts
- Health & Wellbeing
- Personal Development
1125 Data Analysis courses delivered Online
Are you ready to take your data analysis skills to the next level? Introducing the Statistical Analysis and Data Science bundle - the ultimate collection of courses for anyone looking to dive deeper into the world of data. The bundle features a QLS-endorsed course, which means you will receive a QLS hardcopy certificate upon completion. This certificate is a mark of quality and can help you stand out in a competitive job market. But that's not all - the bundle also includes 10 other relevant courses, all CPD-QS accredited, to ensure you have a comprehensive understanding of statistical analysis and data science. You'll learn everything from the basics of statistical analysis to advanced SAS programming and big data analytics. Our courses were designed by people who are passionate about sharing their knowledge with you. With our easy-to-follow modules, you'll be able to learn at your own pace and from the comfort of your own home. Whether you're a seasoned data analyst looking to expand your skills or a newcomer to the field, the Statistical Analysis and Data Science bundle has everything you need to succeed. So why wait? Enrol now and take the first step towards becoming a data analysis expert! This Diploma in Statistical Analysis at QLS Level 5 Bundle Package includes: Course 01: Diploma in Statistical Analysis at QLS Level 5 10 Premium Additional CPD QS Accredited Courses - Course 01: Data Analytics with Tableau Course 02: Big Data Analytics with PySpark Tableau Desktop and MongoDB Course 03: Data Science & Machine Learning with R Training Course 04: SQL for Data Science, Data Analytics and Data Visualization Course 05: Advanced SAS Programming Using MacrosSQL Course 06: SQL NoSQL Big Data and Hadoop Course 07: Statistical Concepts and Application with R Course 08: Business Data Analysis Course 09: Business Intelligence and Data Mining Diploma Course 10: Data Analysis In Excel Why Prefer This Statistical Analysis and Data Science Bundle? You will receive a completely free certificate from the Quality Licence Scheme Option to purchase 10 additional certificates accredited by CPD Get a free Student ID Card - (£10 postal charges will be applicable for international delivery) Free assessments and immediate success results 24/7 Tutor Support After taking this Statistical Analysis and Data Science bundle courses, you will be able to learn: Develop a comprehensive understanding of statistical analysis and data science principles Gain expertise in data analytics tools such as Tableau, PySpark, MongoDB, R, SQL, SAS, and Hadoop Learn advanced data science techniques, including machine learning, data mining, and business intelligence Acquire skills in data visualisation, data cleansing, and data analysis in Excel Apply statistical concepts and methods to real-world scenarios Build a strong foundation in data-driven decision-making Develop problem-solving skills and learn how to make data-driven decisions ***Curriculum breakdown of Statistical Analysis*** Module 01: The Realm of Statistics Module 02: Basic Statistical Terms Module 03: The Center of the Data Module 04: Data Variability Module 05: Binomial and Normal Distributions Module 06: Introduction to Probability Module 07: Estimates and Intervals Module 08: Hypothesis Testing Module 09: Regression Analysis Module 10: Algorithms, Analytics and Predictions Module 11: Learning From Experience: The Bayesian Way Module 12: Doing Statistics: The Wrong Way Module 13: How We Can Do Statistics Better How is the Statistical Analysis and Data ScienceBundle Assessment Process? You have to complete the assignment questions given at the end of the course and score a minimum of 60% to pass each exam. Our expert trainers will assess your assignment and give you feedback after you submit the assignment. You will be entitled to claim a certificate endorsed by the Quality Licence Scheme after you successfully pass the exams. CPD 250 CPD hours / points Accredited by CPD Quality Standards Who is this course for? Professionals looking to expand their skills in data analysis Students interested in a career in data science and analytics Entrepreneurs looking to make data-driven decisions Anyone interested in learning statistical analysis and data science principles Career path Our courses will prepare you for a range of careers, including: Data Analyst: £25,000 - £40,000 Business Analyst: £30,000 - £50,000 Data Scientist: £40,000 - £70,000 Business Intelligence Analyst: £35,000 - £55,000 Big Data Engineer: £50,000 - £80,000 Data Warehouse Architect: £60,000 - £100,000 Certificates CPD QS Accredited Certificate Digital certificate - Included Upon successfully completing the Bundle, you will need to place an order to receive a PDF Certificate for each course within the bundle. These certificates serve as proof of your newly acquired skills, accredited by CPD QS. Also, the certificates are recognised throughout the UK and internationally. CPD QS Accredited Certificate Hard copy certificate - Included International students are subject to a £10 delivery fee for their orders, based on their location. Diploma in Statistical Analysis at QLS Level 5 Hard copy certificate - Included

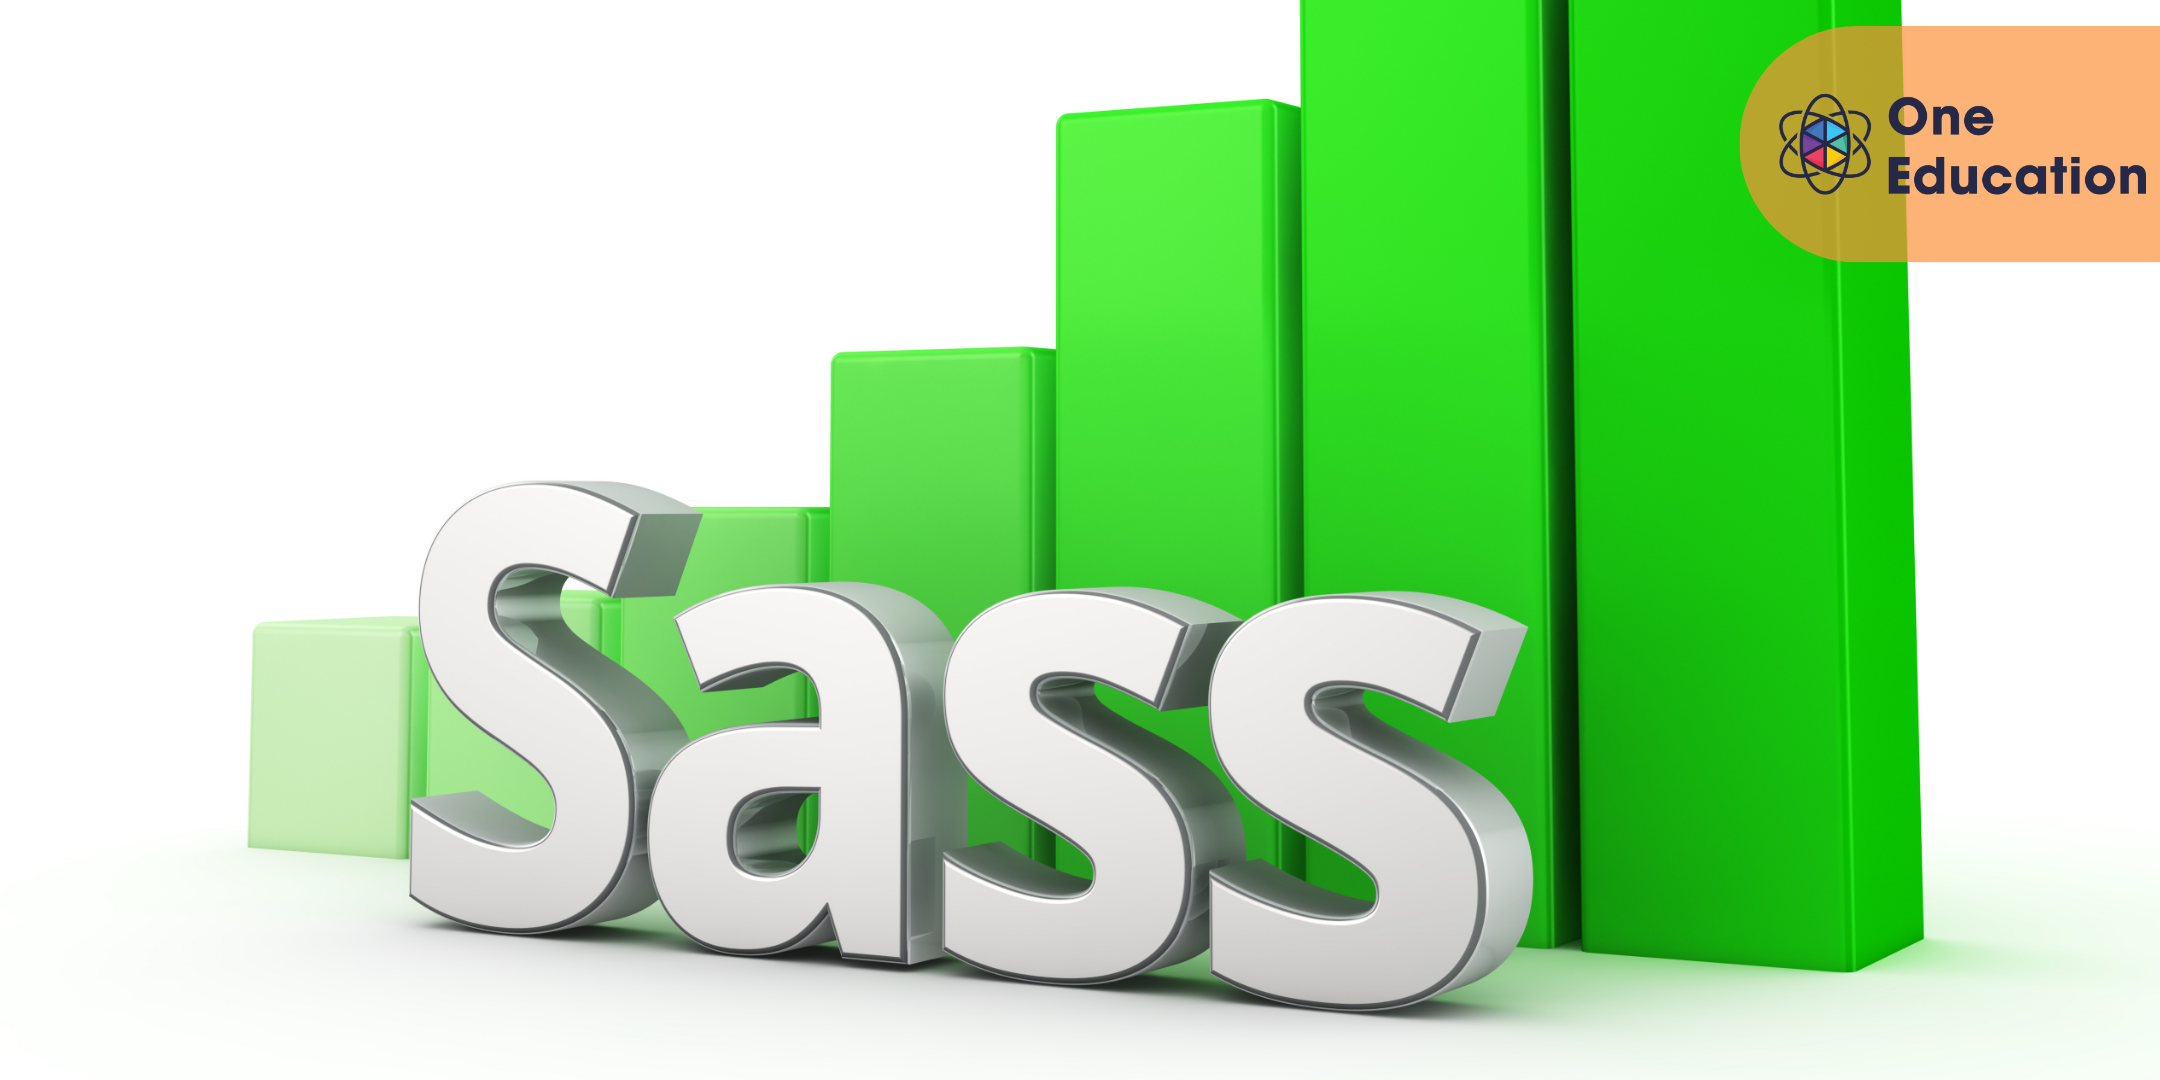
Business Analytics for Beginners Using SASS Course
By One Education
Ready to dive into the numbers without getting buried in them? This course offers a smart introduction to the world of business analytics using SASS — a widely respected tool in the data analysis landscape. Whether you're navigating spreadsheets or spreadsheets are navigating you, this course will help you make sense of the noise and focus on what matters: informed decisions based on accurate analysis. You'll explore key analytics techniques through SASS that help organisations stay ahead in a data-driven marketplace. Designed for those with an interest in decoding business performance, the course walks you through data manipulation, statistical reporting, and pattern identification using SASS. With each module, you'll gain clarity in how data speaks and how to interpret it without needing a PhD in number crunching. It’s approachable, strategic, and ideal for anyone curious about data-driven business decisions — minus the complicated jargon or tangled cables. Learning Outcomes: Understand the basics of SAS data analysis Work with SAS datasets and raw data files Use option statements, ODS statements, and date functions to streamline data analysis Learn how to use multiple SAS datasets to enhance data analysis Develop effective data analysis strategies using SAS Our Business Analytics for Beginners Using SAS course is designed to help you gain a deeper understanding of data analysis using SAS. With 13 comprehensive modules, you will learn how to work with SAS datasets and raw data files, use option statements and ODS statements to streamline your data analysis process, and use date functions to analyse time-based data. You will also learn how to use multiple SAS datasets to enhance your data analysis and develop effective data analysis strategies using SAS. This course is perfect for recent graduates, entry-level data analysts, and professionals looking to enhance their data analysis skills. Whether you're just starting out in the world of data analysis or are an experienced professional looking to take your skills to the next level, this course will provide you with the tools you need to succeed. Business Analytics for Beginners Using SASS Course Curriculum Section 01: Introduction Section 02: SAS Dataset Section 03: Raw Data File Standard And Example Section 04: Raw Data File Non Standard Section 05: Append Section 06: Option Statements Section 07: Title n Foot Note Section 08: ODS statements Section 09: Date Functions Section 10: Multiple SAS datasets Section 11: Select Group Section 12: Do Loop Section 13: Array How is the course assessed? Upon completing an online module, you will immediately be given access to a specifically crafted MCQ test. For each test, the pass mark will be set to 60%. Exam & Retakes: It is to inform our learners that the initial exam for this online course is provided at no additional cost. In the event of needing a retake, a nominal fee of £9.99 will be applicable. Certification Upon successful completion of the assessment procedure, learners can obtain their certification by placing an order and remitting a fee of __ GBP. £9 for PDF Certificate and £15 for the Hardcopy Certificate within the UK ( An additional £10 postal charge will be applicable for international delivery). CPD 10 CPD hours / points Accredited by CPD Quality Standards Who is this course for? Recent graduates looking to start a career in data analysis Entry-level data analysts looking to enhance their skills Professionals looking to transition into the field of data analysis Business owners looking to gain a deeper understanding of data analysis Students looking to explore the field of data analysis Career path Data Analyst: £25,000 - £40,000 Business Analyst: £30,000 - £55,000 Marketing Analyst: £25,000 - £45,000 Data Scientist: £40,000 - £80,000 Senior Business Analyst: £50,000 - £90,000 Certificates Certificate of completion Digital certificate - £9 You can apply for a CPD Accredited PDF Certificate at the cost of £9. Certificate of completion Hard copy certificate - £15 Hard copy can be sent to you via post at the expense of £15.
Data Science: Basics, Data Mining, Excel, Python, SQL, Machine Learning & Tableau
By Imperial Academy
Data Is The Language Of The Powerholders | Designed By Industry Specialists | Level 7 QLS Endorsed Career Objective Driven Data Science Courses | 10 QLS Endorsed Hard Copy Certificates Included | Lifetime Access | Installment Payment | Tutor Support
24 Hours Left! Don't Let Year-End Deals Slip Away - Enrol Now! Are you tired of being stuck in a job that doesn't pay you what you're worth? Are you ready to take your career to the next level? As a Business Intelligence Analyst, you can earn an average salary of £30,000 to £60,000 per year in the UK. Our Business Intelligence Analyst bundle is designed to equip you with the skills and knowledge you need to succeed in this lucrative field. The bundle includes a QLS-endorsed course, which comes with a free hardcopy certificate, as well as ten additional courses that are CPD-QS accredited. With our training, you'll learn everything from business data analysis to strategic business planning, financial analysis to investment, and marketing to research methods in business. By the end of the bundle, you'll have a comprehensive understanding of the business intelligence and data analysis industry, giving you a competitive edge in the job market. Don't let another year go by without reaching your full potential. Invest in your future with our Business Intelligence Analyst bundle and start earning the salary you deserve. Enrol now and take the first step towards your dream career! 10 Premium Additional CPD QS Accredited Courses - Course 01: Business Data Analysis Course 02: Business Intelligence and Data Mining Diploma Course 03: Research Methods in Business Course 04: Business Analyst: Project Management Techniques Course 05: Strategic Business Planning Course 06: Make Business Plans: Forecasting and Budgeting Course 07: Online Financial Modelling Training Course 08: Financial Analysis Course Course 09: Investment Course 10: Marketing Course Why Prefer This Business Intelligence Analyst Bundle? You will receive a completely free certificate from the Quality Licence Scheme Option to purchase 10 additional certificates accredited by CPD Get a free Student ID Card - (£10 postal charges will be applicable for international delivery) Free assessments and immediate success results 24/7 Tutor Support Module-01: An Introduction to Business Intelligence Module-02: Real-time Business Intelligence Module-03: Fundamentals of Statistics and Data Science Module-04: Fundamentals of SQL Module-05: Database Management Essentials Module-06: Data Warehouse Concepts Module-07: Data Visualisation in Business Intelligence Module-08: Basics of Python How is the Business Intelligence AnalystBundle Assessment Process? You have to complete the assignment questions given at the end of the course and score a minimum of 60% to pass each exam. Our expert trainers will assess your assignment and give you feedback after you submit the assignment. You will be entitled to claim a certificate endorsed by the Quality Licence Scheme after you successfully pass the exams. CPD 250 CPD hours / points Accredited by CPD Quality Standards Who is this course for? Professionals looking to enhance their skills in business intelligence and data analysis. Individuals interested in a career as a Business Intelligence Analyst. Graduates looking to enter the business intelligence and data analysis industry Career path Our courses will prepare you for a range of careers, including: Junior Business Intelligence Analyst: £25,000 to £35,000 per year Business Intelligence Analyst: £40,000 to £60,000 per year Financial Analyst: £30,000 to £60,000 per year Certificates CPD QS Accredited Certificate Digital certificate - Included Upon successfully completing the Bundle, you will need to place an order to receive a PDF Certificate for each course within the bundle. These certificates serve as proof of your newly acquired skills, accredited by CPD QS. Also, the certificates are recognised throughout the UK and internationally. CPD QS Accredited Certificate Hard copy certificate - Included International students are subject to a £10 delivery fee for their orders, based on their location. Diploma in Business Intelligence Analyst at QLS Level 5 Hard copy certificate - Included

Business Intelligence Analyst Course
By The Teachers Training
Unlock the power of data-driven decision-making with our Business Intelligence Analyst Course. Gain essential skills in data analysis, visualization, and interpretation to extract valuable insights for business growth. Whether you're a seasoned professional or new to the field, this course provides comprehensive training in business intelligence tools and techniques. Enroll now and become proficient in transforming raw data into actionable intelligence, empowering organizations to make informed strategic decisions.

Data Science and Machine Learning with R from A-Z Course [Updated for 2021]
By Packt
In this practical, hands-on course, you'll learn how to use R for effective data analysis and visualization and how to make use of that data in a practical manner. You will learn how to install and configure software necessary for a statistical programming environment and describe generic programming language concepts as they are implemented in a high-level statistical language.
![Data Science and Machine Learning with R from A-Z Course [Updated for 2021]](https://cademy-images-io.b-cdn.net/bab38fc7-4e4f-4573-8132-6b5a58158af4/ac0e92d0-0331-4aec-b894-3e145b37186c/original.jpeg?width=3840)
ArcGIS Desktop for Spatial Analysis: Go from Basic to Pro
By Packt
Gain proficiency in the mastery of Geographic Information Systems (GIS) via ArcGIS Desktop
Practical Data Science Using Python.
By Packt
This course covers Python for data science and machine learning in detail and is for a beginner in Python. You will also learn about core concepts of data science, exploratory data analysis, statistical methods, role of data, challenges of bias, variance and overfitting, model evaluation techniques, model optimization using hyperparameter tuning, grid search cross-validation techniques, and more.
Tired of browsing and searching for a Analytics Training course you are looking for? Can't find the complete package that fulfils all your needs? Then don't worry as you have just found the solution. Take a minute and look through this extensive bundle that has everything you need to succeed. After surveying thousands of learners just like you and considering their valuable feedback, this all-in-one Analytics Training bundle has been designed by industry experts. We prioritised what learners were looking for in a complete package and developed this in-demand Analytics Training course that will enhance your skills and prepare you for the competitive job market. Also, our experts are available for answering your queries on Analytics Training and help you along your learning journey. Advanced audio-visual learning modules of these Analytics Training courses are broken down into little chunks so that you can learn at your own pace without being overwhelmed by too much material at once. Furthermore, to help you showcase your expertise in Analytics Training, we have prepared a special gift of 1 hardcopy certificate and 1 PDF certificate for the title course completely free of cost. These certificates will enhance your credibility and encourage possible employers to pick you over the rest. This Analytics Training Bundle Consists of the following Premium courses: Course 01: Introduction to Data Analysis Course 02: Google Data Studio: Data Analytics Course 03: Data Analytics with Tableau Course 04: Python for Data Analysis Course 05: Complete Microsoft Power BI 2021 Course 06: Fundamentals of Business Analysis Course 07: Statistical Analysis Course 08: Statistics & Probability for Data Science & Machine Learning Course 09: RCA: Root Cause Analysis Course 10: Master JavaScript with Data Visualization Course 11: CompTIA CySA+ Cybersecurity Analyst (CS0-002) Course 12: Electronic Document Management System Step Course 13: Quick Data Science Approach from Scratch Course 14: IT For Recruiters Enrol now in Analytics Training to advance your career, and use the premium study materials from Apex Learning. The bundle incorporates basic to advanced level skills to shed some light on your way and boost your career. Hence, you can strengthen your Analytics Training expertise and essential knowledge, which will assist you in reaching your goal. Curriculum: Module 01: Introduction Module 02: Agenda and Principles of Process Management Module 03: The Voice of the Process Module 04: Working as One Team for Improvement Module 05: Exercise: The Voice of the Customer Module 06: Tools for Data Analysis Module 07: The Pareto Chart Module 08: The Histogram Module 09: The Run Chart Module 10: Exercise: Presenting Performance Data Module 11: Understanding Variation Module 12: The Control Chart Module 13: Control Chart Example Module 14: Control Chart Special Cases Module 15: Interpreting the Control Chart Module 16: Control Chart Exercise Module 17: Strategies to Deal with Variation Module 18: Using Data to Drive Improvement Module 19: A Structure for Performance Measurement Module 20: Data Analysis Exercise Module 21: Course Project Module 22: Test your Understanding CPD 165 CPD hours / points Accredited by CPD Quality Standards Who is this course for? Anyone from any background can enrol in this Analytics Training bundle. Requirements Our Analytics Training course is fully compatible with PCs, Macs, laptops, tablets and Smartphone devices. Career path Having this Analytics Training expertise will increase the value of your CV and open you up to multiple job sectors. Certificates Certificate of completion Digital certificate - Included You will get the PDF Certificate for the title course (Introduction to Data Analysis) absolutely Free! Certificate of completion Hard copy certificate - Included You will get the Hard Copy certificate for the title course (Introduction to Data Analysis) absolutely Free! Other Hard Copy certificates are available for £10 each. Please Note: The delivery charge inside the UK is £3.99, and the international students must pay a £9.99 shipping cost.

Are you ready to dive deep into the world of data analytics? Look no further than our Data Analytics with Tableau bundle, featuring 11 comprehensive courses that will give you the skills and knowledge needed to succeed in the world of data analysis. Begin with the QLS-endorsed Advanced Diploma in Data Analytics with Tableau at QLS Level 6, and receive a free hardcopy certificate upon completion. This prestigious certification will set you apart from your peers. Continue your learning journey with ten additional courses, all CPD-QS accredited, covering everything from SQL Masterclass to GDPR compliance. Our courses are designed to provide a theoretical understanding of data analytics that will serve as a strong foundation for your future career in the field. Whether you're just starting out in data analytics or are a seasoned professional looking to expand your knowledge, our Data Analytics with Tableau bundle is the perfect choice for you. Enrol now and take the first step towards a brighter future in the exciting world of data analytics. This Data Analytics with Tableau Bundle Package includes: Course 01: Advanced Diploma in Data Analytics with Tableau at QLS Level 6 10 Premium Additional CPD QS Accredited Courses - Course 01: Data Analysis Course 02: SQL Masterclass: SQL For Data Analytics Course 03: Data Science & Machine Learning with R Training Course 04: Google Data Studio Course 05: Excel Data Analysis Course 06: Microsoft Excel: Automated Dashboard Using Advanced Formula, VBA, Power Query Course 07: Business Intelligence and Data Mining Diploma Course 08: Business Data Analysis Course 09: Statistical Analysis Course 10: GDPR Why Prefer This Data Analytics with Tableau Bundle? You will receive a completely free certificate from the Quality Licence Scheme Option to purchase 10 additional certificates accredited by CPD Get a free Student ID Card - (£10 postal charges will be applicable for international delivery) Free assessments and immediate success results 24/7 Tutor Support After taking this Data Analytics with Tableau bundle courses, you will be able to learn: Gain a thorough understanding of data analytics concepts and tools. Master Tableau and Excel for data analysis and visualisation. Learn how to work with SQL and relational databases for data management. Develop skills in data science and machine learning using R. Understand the principles of business intelligence and data mining. Gain knowledge of statistical analysis and interpretation of results. Acquire a comprehensive understanding of GDPR compliance and regulations. ***Curriculum breakdown of Data Analytics with Tableau*** Module 01: Introduction to the Course Module 02: Project 1: Discount Mart (Sales and Profit Analytics) Module 03: Project 2: Green Destinations (HR Analytics) Module 04: Project 3: Superstore (Sales Agent Tracker) Module 05: Northwind Trade (Shipping Analytics) Module 06: Project 5: Tesla (Stock Price Analytics) Module 07: Bonus: Introduction to Database Concepts Module 08: Tableau Stories How is the Data Analytics with TableauBundle Assessment Process? You have to complete the assignment questions given at the end of the course and score a minimum of 60% to pass each exam. Our expert trainers will assess your assignment and give you feedback after you submit the assignment. You will be entitled to claim a certificate endorsed by the Quality Licence Scheme after you successfully pass the exams. CPD 250 CPD hours / points Accredited by CPD Quality Standards Who is this course for? Individuals interested in pursuing a career in data analytics. Professionals seeking to enhance their data analysis skills. Business analysts, data scientists, and statisticians. Anyone looking to gain a theoretical foundation in data analytics. Career path Data Analyst: £20k-£48k per year Business Intelligence Analyst: £24k-£60k per year Data Scientist: £33k-£75k per year Business Analyst: £24k-£50k per year Data Engineer: £28k-£80k per year Statistician: £25k-£45k per year Note: Salary ranges are subject to change depending on location, experience, and industry. Certificates Advanced Diploma in Data Analytics with Tableau at QLS Level 6 Hard copy certificate - Included After successfully completing the course, you can order an original hardcopy Certificate of Achievement endorsed by the Quality Licence Scheme. This certificate will be delivered to your home, free of charge. To obtain the additional Quality License Scheme Endorsed Certificate, you will need to pay the corresponding fee based on the level of the courses: Level 1: £59 Level 2: £79 Level 3: £89 Level 4: £99 Level 5: £119 Level 6: £129 Level 7: £139 CPD QS Accredited Certificate Digital certificate - £10 Upon successfully completing the Bundle, you will need to place an order to receive a PDF Certificate for each course within the bundle. These certificates serve as proof of your newly acquired skills, accredited by CPD QS and will cost you £10 for each course. Also, the certificates are recognised throughout the UK and internationally. CPD QS Accredited Certificate Hard copy certificate - £29 International students are subject to a £10 delivery fee for their orders, based on their location.