- Professional Development
- Medicine & Nursing
- Arts & Crafts
- Health & Wellbeing
- Personal Development
406 Business Intelligence (BI) courses in Cardiff delivered Online
Visual Analytics Best Practice
By Tableau Training Uk
This course is very much a discussion, so be prepared to present and critically analyse your own and class mates work. You will also need to bring a few examples of work you have done in the past. Learning and applying best practice visualisation principles will improve effective discussions amongst decision makers throughout your organisation. As a result more end-users of your dashboards will be able to make better decisions, more quickly. This 2 Day training course is aimed at analysts with good working knowledge of BI tools (we use Tableau to present, but attendees can use their own software such as Power BI or Qlik Sense). It is a great preparation for taking advanced certifications, such as Tableau Certified Professional. Contact us to discuss the Visual Analytics Best Practice course Email us if you are interested in an on-site course, or would be interested in different dates and locations This Tableau Desktop training intermediate course is designed for the professional who has a solid foundation with Tableau and is looking to take it to the next level. Attendees should have a good understanding of the fundamental concepts of building Tableau worksheets and dashboards typically achieved from having attended our Tableau Desktop Foundation Course. At the end of this course you will be able to communicate insights more effectively, enabling your organisation to make better decisions, quickly. The Tableau Desktop Analyst training course is aimed at people who are used to working with MS Excel or other Business Intelligence tools and who have preferably been using Tableau already for basic reporting. The course includes the following topics: WHAT IS VISUAL ANALYSIS? Visual Analytics Visual Analytics Process Advantages of Visual Analysis Exercise: Interpreting Visualisations HOW DO WE PROCESS VISUAL INFORMATION? Memory and Processing Types Exercise: Identifying Types of Processing Cognitive Load Exercise: Analysing Cognitive Load Focus and Guide the Viewer Remove Visual Distractions Organise Information into Chunks Design for Proximity Exercise: Reducing Cognitive Load SENSORY MEMORY Pre-attentive Attributes Quantitatively-Perceived Attributes Categorically-Perceived Attributes Exercise: Analysing Pre-attentive Attributes Form & Attributes Exercise: Using Form Effectively Colour & Attributes Exercise: Using Colour Effectively Position & Attributes Exercise: Using Position Effectively ENSURING VISUAL INTEGRITY Informing without Misleading Gestalt Principles Visual Area Axis & Scale Colour Detail Exercise: Informing without Misleading CHOOSING THE RIGHT VISUALISATION Comparing and Ranking Categories Comparing Measures Comparing Parts to Whole Viewing Data Over Time Charts Types for Mapping Viewing Correlation Viewing Distributions Viewing Specific Values DASHBOARDS AND STORIES Exercise: Picking the Chart Type Exercise: Brainstorming Visual Best Practice Development Process for Dashboards and Stories Plan the Visualisation Create the Visualisation Test the Visualisation Exercise: Designing Dashboards and Stories This training course includes over 20 hands-on exercises to help participants “learn by doing” and to assist group discussions around real-life use cases. Each attendee receives an extensive training manual which covers the theory, practical applications and use cases, exercises and solutions together with a USB with all the materials required for the training. The course starts at 09:30 on the first day and ends at 17:00. On the second day the course starts at 09:00 and ends at 17:00. Students must bring their own laptop with an active version of Tableau Desktop 10.5 (or later) pre-installed. What People Are Saying About This Course "Steve was willing to address questions arising from his content in a full and understandable way"Lisa L. "Really enjoyed the course and feel the subject and the way it was taught was very close to my needs"James G. "The course tutor Steve was incredibly helpful and taught the information very well while making the two days very enjoyable."Bradd P. "The host and his courses will give you the tools and confidence that you need to be comfortable with Tableau."Jack S. "Steve was fantastic with his knowledge and knowhow about the product. Where possible he made sure you could put demonstrations in to working practice, to give the audience a clear understanding."Tim H. "This was a very interesting and helpful course, which will definitely help me produce smarter, cleaner visualisations that will deliver more data-driven insights within our business."Richard A. "Steve is very open to questions and will go out of his way to answer any query. Thank you"Wasif N. "Steve was willing to address questions arising from his content in a full and understandable way"Lisa L. "Really enjoyed the course and feel the subject and the way it was taught was very close to my needs"James G.

Tableau Desktop Training - Analyst
By Tableau Training Uk
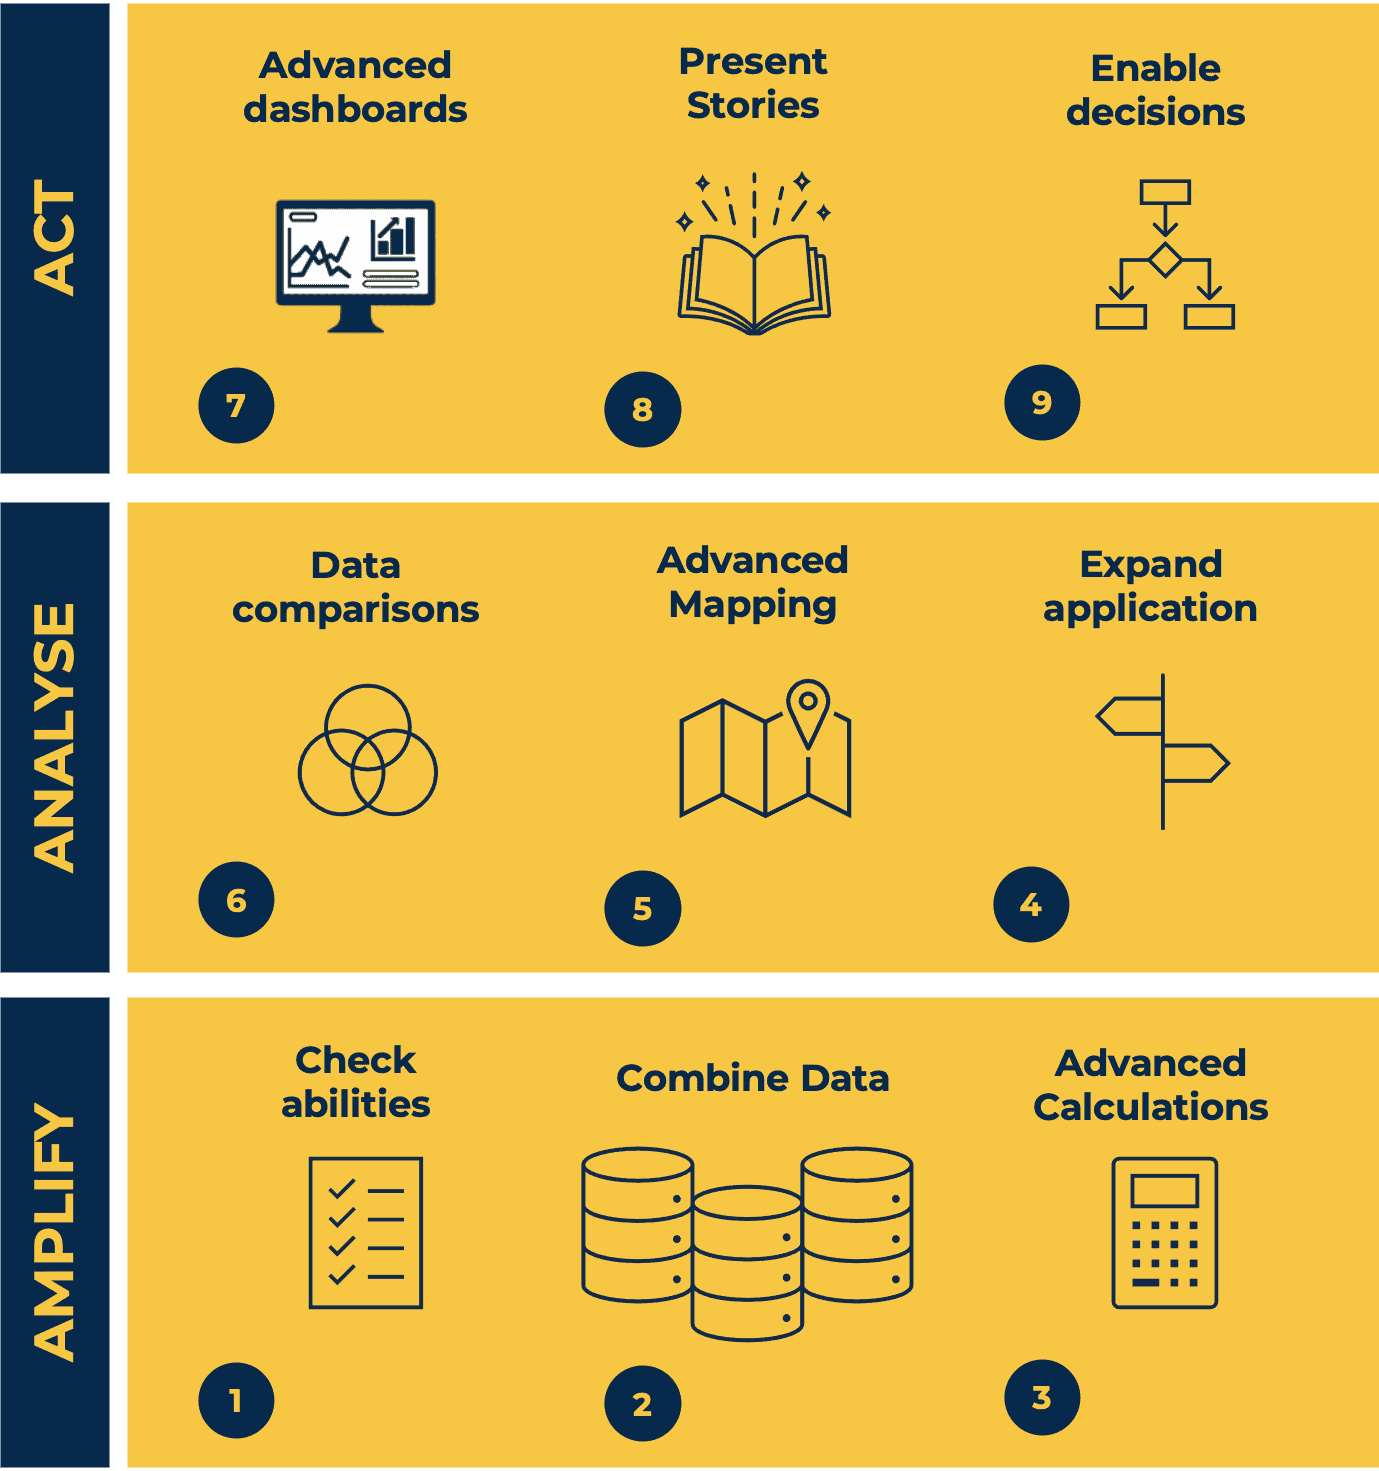
This Tableau Desktop Training intermediate course is designed for the professional who has a solid foundation with Tableau and is looking to take it to the next level. For Private options, online or in-person, please send us details of your requirements: This Tableau Desktop training intermediate course is designed for the professional who has a solid foundation with Tableau and is looking to take it to the next level. Attendees should have a good understanding of the fundamental concepts of building Tableau worksheets and dashboards typically achieved from having attended our Tableau Desktop Foundation Course. At the end of this course you will be able to communicate insights more effectively, enabling your organisation to make better decisions, quickly. The Tableau Desktop Analyst training course is aimed at people who are used to working with MS Excel or other Business Intelligence tools and who have preferably been using Tableau already for basic reporting. The course is split into 3 phases and 9 modules: Phase 1: AMPLIFY MODULE 1: CHECK ABILITIES Revision – What I Should Know What is possibleHow does Tableau deal with dataKnow your way aroundHow do we format chartsHow Tableau deals with datesCharts that compare multiple measuresCreating Tables MODULE 2: COMBINE DATA Relationships Joining Tables – Join Types, Joining tables within the same database, cross database joins, join calculations Blending – How to create a blend with common fields, Custom defined Field relationships and mismatched element names, Calculated fields in blended data sources Unions – Manual Unions and mismatched columns, Wildcard unions Data Extracts – Creating & Editing Data extracts MODULE 3: ADVANCED CALCULATIONS Row Level v Aggregations Aggregating dimensions in calculations Changing the Level of Detail (LOD) of calculations – What, Why, How Adding Table Calculations Phase 2: ANALYSE MODULE 4: EXPAND APPLICATION Making things dynamic with parameters Sets Trend Lines How do we format charts Forecasting MODULE 5: ADVANCED MAPPING Using your own images for spatial analysis Mapping with Spatial files MODULE 6: DATA COMPARISONS Advanced Charts Bar in Bar charts Bullet graphs Creating Bins and Histograms Creating a Box & Whisker plot Phase 3: ACT MODULE 7: ADVANCED DASHBOARDS Using the dashboard interface and Device layout Dashboard Actions and Viz In tooltips Horizontal & Vertical containers Navigate between dashboards MODULE 8: PRESENT STORIES Telling data driven stories MODULE 9: ENABLE DECISIONS What is Tableau Server Publishing & Permissions How can your users engage with content This training course includes over 25 hands-on exercises and quizzes to help participants “learn by doing” and to assist group discussions around real-life use cases. Each attendee receives a login to our extensive training portal which covers the theory, practical applications and use cases, exercises, solutions and quizzes in both written and video format. Students must bring their own laptop with an active version of Tableau Desktop 2018.2 (or later) pre-installed. What People Are Saying About This Course “Course was fantastic, and completely relevant to the work I am doing with Tableau. I particularly liked Steve’s method of teaching and how he applied the course material to ‘real-life’ use-cases.”Richard W., Dashboard Consulting Ltd “This course was extremely useful and excellent value. It helped me formalise my learning and I have taken a lot of useful tips away which will help me in everyday work.” Lauren M., Baillie Gifford “I would definitely recommend taking this course if you have a working knowledge of Tableau. Even the little tips Steve explains will make using Tableau a lot easier. Looking forward to putting what I’ve learned into practice.”Aron F., Grove & Dean “Steve is an excellent teacher and has a vast knowledge of Tableau. I learned a huge amount over the two days that I can immediately apply at work.”John B., Mporium “Steve not only provided a comprehensive explanation of the content of the course, but also allowed time for discussing particular business issues that participants may be facing. That was really useful as part of my learning process.”Juan C., Financial Conduct Authority “Course was fantastic, and completely relevant to the work I am doing with Tableau. I particularly liked Steve’s method of teaching and how he applied the course material to ‘real-life’ use-cases.”Richard W., Dashboard Consulting Ltd “This course was extremely useful and excellent value. It helped me formalise my learning and I have taken a lot of useful tips away which will help me in everyday work.” Lauren M., Baillie Gifford “I would definitely recommend taking this course if you have a working knowledge of Tableau. Even the little tips Steve explains will make using Tableau a lot easier. Looking forward to putting what I’ve learned into practice.”Aron F., Grove & Dean “Steve is an excellent teacher and has a vast knowledge of Tableau. I learned a huge amount over the two days that I can immediately apply at work.”John B., Mporium
Microsoft Power BI Reports and Dashboards for Business Users
By Nexus Human
Duration 1 Days 6 CPD hours This course is intended for Anyone whose role requires them to use existing Power BI Reports or Dashboards to consume the contents. Roles can include management at all levels, team leaders or anyone who needs to commission the production of reports or dashboards. It is assumed that attendees on the course are familiar with charts. Please note that this course is not suitable for new Excel users, delegates need Ability to create charts Ability to use filters in data Overview This course covers the use of Power BI Desktop and the Power BI service hosted in Office 365 to identify core features, terminology and processes applicable when using reports or dashboards.Delegates will learn how to: Power BI Concepts and Main Features How a report is created Navigating reports and dashboards How to apply filters and slicers To use Insights, Analytics and Natural Language Queries Power BI provides a variety of methods for using reports and dashboards within which data can be viewed and analyzed visually. Getting Started with Power BI Power BI Concepts and Versions Introduction to Main Features: Jargon buster From Data to Reports and Dashboards Visualizations Overview Visualizations Available Visualizations as Filter Reports and Dashboards Similarities and differences Understanding what you are looking at Understanding what you are looking at Using a Report in Power BI Filters, sorting and using slicers See the actual data See Data and See Records Drill visualizations Off the shelf data analysis Quick Conditional Formatting Analytics lines Use Insight for Increases and Decrease Forecast Analytics Changing calculations and Show As Working with Dashboards Dashboards in Power BI Defined How is a dashboard different from a report? Working in the Dashboard window

Microsoft Power BI Online
By Nexus Human
Duration 1 Days 6 CPD hours This course is intended for The student should be familiar with Excel and the concepts of datasets and basic reporting. Overview Understand and utilize Power BI Online. Understand and examine the differences between Power BI Desktop and Power BI Online. Understand and explore the Power BI Online interface. Understand and perform importing Excel worksheets, CSV, TXT, PBIX. Understand connecting to databases. Understand other forms of data. Understand data refresh. Understand and perform creating a new Power BI report. Understand and perform adding filters to a report. Understand and perform adding KPI's to a report. Understand and perform creating a Power BI dashboard. Understand and perform pinning tiles. Understand sharing reports and dashboards. Understand Power BI Mobile. This Logical Operations courseware is no longer available on the LO Store, but can be purchased by phone orderThis one-day course familiarizes the student with Power BI Online, which allows the student to intuitively discover and automate the import, transformation, and combination of data across a variety of data sources. COURSE OVERVIEW Introduction Course Materials Facilities Prerequisites What We'll Be Discussing INTRODUCTION TO POWER BI ONLINE What is Power BI Online Examining the Differences Between Power BI Desktop and Power BI Online Exploring the Power BI Online Interface IMPORTING DATA Utilizing Excel (.xlsx or .xlsm), Comma Separated Value (.csv), and Power BI Desktop (.pbix) Files Connecting to Databases Examining Other Forms of Data Understanding Data Refresh CREATING REPORTS Creating a New Power BI Report Adding Filters to a Power BI Report Adding KPI?s to a Report CONFIGURING DASHBOARDS Creating a Power BI Dashboard Pinning Tiles SHARING REPORTS AND DASHBOARDS Sharing Reports and Dashboards Exploring Power BI Mobile
Oracle BI 11g R1 - Build Repositories
By Nexus Human
Duration 5 Days 30 CPD hours This course is intended for Application DevelopersBusiness AnalystsBusiness Intelligence DeveloperData ModelersData Warehouse AdministratorData Warehouse AnalystReports DeveloperTechnical Consultant Overview Build and run analyses to test and validate a repositorySet up query logging for testing and debuggingSet up a multiuser development environmentUse the Administration Tool wizards and utilities to manage, maintain, and enhance repositoriesEnable usage tracking to track queries and database usage, and improve query performancePerform a patch merge in a development-to-production scenarioDescribe Exalytics machine and the Summary Advisor tool used in the machineBuild simple and calculated measures for a fact tableCreate logical dimension hierarchies and level-based measuresCheck the model and then model aggregate tables to speed query processingModel partitions and fragments to improve application performance and usabilityUse variables to streamline administrative tasks and modify metadata content dynamicallyUse time series functions to support historical time comparison analysesSet up security to authenticate users and assign appropriate permissions and privilegesBuild the Physical, Business Model and Mapping, and Presentation layers of a repositoryApply cache management techniques to maintain and enhance query performance This Oracle BI 11g R1: Build Repositories training is based on OBI EE release 11.1.1.7. Expert Oracle University instructors will teach you step-by-step procedures for building and verifying the three layers of an Oracle BI repository. This Oracle BI 11g R1: Build Repositories training is based on OBI EE release 11.1.1.7. Expert Oracle University instructors will teach you step-by-step procedures for building and verifying the three layers of an Oracle BI repository. Additional course details: Nexus Humans Oracle BI 11g R1 - Build Repositories training program is a workshop that presents an invigorating mix of sessions, lessons, and masterclasses meticulously crafted to propel your learning expedition forward. This immersive bootcamp-style experience boasts interactive lectures, hands-on labs, and collaborative hackathons, all strategically designed to fortify fundamental concepts. Guided by seasoned coaches, each session offers priceless insights and practical skills crucial for honing your expertise. Whether you're stepping into the realm of professional skills or a seasoned professional, this comprehensive course ensures you're equipped with the knowledge and prowess necessary for success. While we feel this is the best course for the Oracle BI 11g R1 - Build Repositories course and one of our Top 10 we encourage you to read the course outline to make sure it is the right content for you. Additionally, private sessions, closed classes or dedicated events are available both live online and at our training centres in Dublin and London, as well as at your offices anywhere in the UK, Ireland or across EMEA.
Power BI - introduction to intermediate (2 days) (In-House)
By The In House Training Company
This course starts with the basics then moves seamlessly to an intermediate level. It includes a comprehensive yet balanced look at the four main components that make up Power BI Desktop: Report view, Data view, Model view, and the Power Query Editor. It also demonstrates how to use the online Power BI service. It looks at authoring tools that enables you to connect to and transform data from a variety of sources, allowing you to produce dynamic reports using a library of visualisations. Once you have those reports, the course looks at the seamless process of sharing those with your colleagues by publishing to the online Power BI service. The aim of this course is to provide a strong understanding of the Power BI analysis process, by working with real-world examples that will equip you with the necessary skills to start applying your knowledge straight away. 1 Getting started The Power BI process Launching Power BI Desktop The four views of Power BI Dashboard visuals 2 Connecting to files Connect to data sources Connect to an Excel file Connect to a CSV file Connect to a database Import vs. DirectQuery Connect to a web source Create a data table 3 Transforming data The process of cleaning data Column data types Remove rows with filters Add a custom column Append data to a table Fix error issues Basic maths operations 4 Build a data model Table relationships Manage table relationships 5 Merge queries Table join kinds Merging tables 6 Create report visualisations Creating map visuals Formatting maps Creating chart visuals Formatting chart Tables, matrixes, and cards Control formatting with themes Filter reports with slicers Reports for mobile devices Custom online visuals Export report data to Excel 7 The power query editor Fill data up and down Split columns by delimiter Add conditional columns Merging columns 8 The M formula Creating M functions Create an IF function Create a query group 9 Pivot and unpivot tables Pivot tables in the query editor Pivot and append tables Pivot but don't summarise Unpivot tables Append mismatched headers 10 Data modelling revisited Data model relationships Mark a calendar as a date table 11 Introduction to calculated columns New columns vs. measures Creating a new column calculation The SWITCH function 12 Introduction to DAX measures Common measure categories The SUM measure Adding measures to visuals COUNTROWS and DISINCTCOUNT functions DAX rules 13 The CALCULATE measure The syntax of CALCULATE Things of note about CALCULATE 14 The SUMX measure The SUMX measure X iterator functions Anatomy of SUMX 15 Introduction to time intelligence Importance of a calendar table A special lookup table The TOTALYTD measure Change year end in TOTALYTD 16 Hierarchy, groups and formatting Create a hierarchy to drill data Compare data in groups Add conditional formatting 17 Share reports on the web Publish to the BI online service Get quick insights Upload reports from BI service Exporting report data What is Q&A? Sharing your reports 18 Apply your learning Post training recap lesson
