- Professional Development
- Medicine & Nursing
- Arts & Crafts
- Health & Wellbeing
- Personal Development
169 Business Analytics & Intelligence courses delivered Live Online
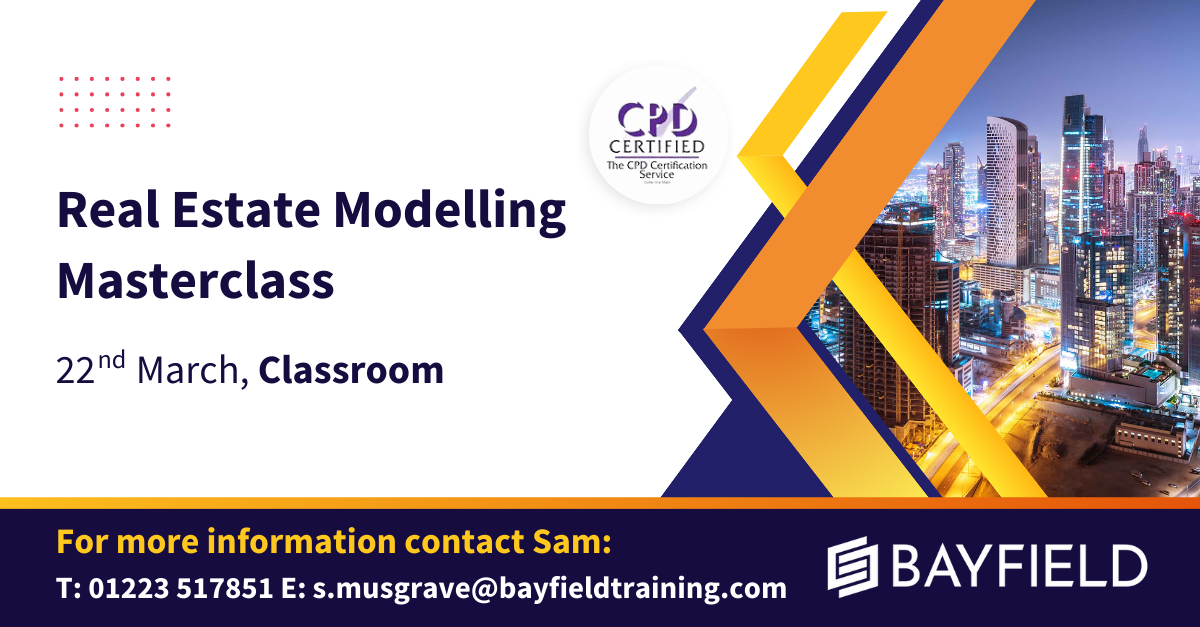
The Real Estate Analyst course has been taught non-stop to global real estate firms over the last 25 years, and is without doubt the core financial modelling training in your career portfolio. Whether you have an upcoming financial modelling test for a new job or an APC exam, the Real Estate Analyst course is the choice for you.

Data storytelling
By Fire Plus Algebra
Data has become the most important resource for every organisation – but the insights gained from data analysis will only ever be truly valuable if they can be clearly expressed to other people. This course is for anybody who works with data, and needs to communicate the meaning that's in the numbers to colleagues, customers, bosses or external stakeholders. It will give you or your team the confidence and skills to translate raw data into compelling visual stories for your key audiences. The principles and skills covered apply to the simplest PowerPoint chart, to more complex interactive visualisations. We’ll work with you before the course to ensure that we understand your organisation and what you’re hoping to achieve. Sample learning content Session 1: What makes a great data-driven story The key elements of a successful infographic or presentation. Industry best practice, and discussion of good (and bad) examples. A simple framework for identifying the Audience, Story and Action. Session 2: Data in context How to balance function and aesthetic appeal. Identifying the right graph, chart, infographic or other visual. Framing the data and providing contextual information. Session 3: Designing for the human brain Using colours to add emphasis and meaning. Design and layout principles, and creating hierarchies of information. The principle of ‘self-sufficiency’, and removing clutter. Session 4: Navigation and narrative Tailoring visualisations for different types of communications. Structuring presentations and longer reports. Thinking in layers to create interactive dashboards. Delivery We deliver our courses over Zoom, to maximise flexibility. The training can be delivered in a single day, or across multiple sessions. All of our courses are live and interactive – every session includes a mix of formal tuition and hands-on exercises. To ensure this is possible, the number of attendees is capped at 16 people. Tutor Alan Rutter is the founder of Fire Plus Algebra. He is a specialist in communicating complex subjects through data visualisation, writing and design. He teaches for General Assembly and runs in-house training for public sector clients including the Home Office, the Department of Transport, the Biotechnology and Biological Sciences Research Council, the Health Foundation, and numerous local government and emergency services teams. He previously worked with Guardian Masterclasses on curating and delivering new course strands, including developing and teaching their B2B data visualisation courses. He oversaw the iPad edition launches of Wired, GQ, Vanity Fair and Vogue in the UK, and has worked with Condé Nast International as product owner on a bespoke digital asset management system for their 11 global markets. Testimonial “I was familiar with Alan’s work as a Guardian Masterclass instructor on data visualisation and digital journalism, which made it easy for me to recommend him for onsite training at the Liverpool School of Tropical Medicine. We had a large group of people interested in honing their abilities to depict their research and stories in engaging ways. Alan’s course provided great insight about common communication pitfalls and how to avoid them, how to become better communicators by understanding the audience diversity, and it showcased some great online tools for creating infographics. This should be mandatory training for all students, academics, report writers and those involved with conveying research to the media as it will help increase the clarity and accessibility of our own research stories.” Dr Lee Haines | Liverpool School of Tropical Medicine

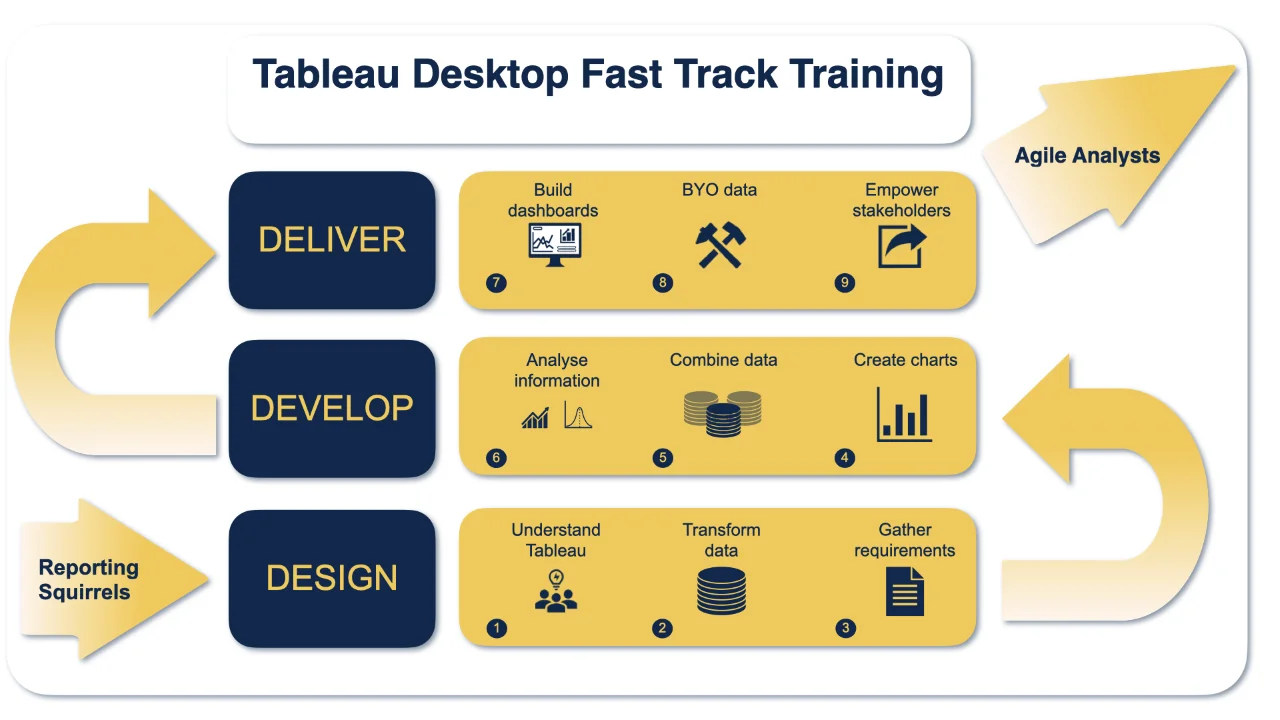
Tableau Training On Tap - Fast Track
By Tableau Training Uk
Tableau is an intuitive and simple tool to learn. This Tableau training course is a jumpstart to getting report writers and analysts who are self-taught or have no previous knowledge to being productive. It covers everything from connecting to data, through to creating interactive dashboards with a range of visualisations in three days. Having a quick turnaround from starting to use Tableau, to getting real, actionable insights means that you get a swift return on your investment. At the end of this course, you will be able to communicate insights more effectively, enabling your organisation to make better decisions, quickly. This accelerated approach is key to getting engagement from within your organisation so everyone can immediately see and feel the impact of the data and insights you create. Our Tableau Desktop Fast Track course combines all of our Foundation (Fundamentals) and Analyst (Intermediate) content into a 3 day live online course with added access to online bonus content of 3 additional modules. Gathering Requirements, Bring Your Own Data and Engaging Users. What do you get? This course is delivered live virtually and has all material provided through our online portal, together with email support and live coaching sessions. The full program includes all of the following elements: 3 days of live and interactive instructor-led sessions delivered by an expert Tableau Trainer 6 weeks access to our live coaching program delivered by expert Tableau coaches 50+ practical exercises to practice what you learn 12 months access to video’s that walk you through the theory and exercise solutions Practical advice, tools and resources for using Tableau in the real world The three additional online modules provide:Clarity on the approach to gathering dashboard requirements in a way that can be translated into dashboard designs.An agile and iterative development process that delivers products that meet user needs more quickly and effectively.An understanding of how end users will interact with dashboards to ensure that designers deliver actionable results. THE SYLLABUS PHASE 1: DESIGN MODULE 1: UNDERSTAND TABLEAU What is possible How does Tableau deal with data Know your way around Review of Type Conversions How do we format charts Dashboard basics – My first Dashboard MODULE 2: TRANSFORM DATA Connecting to and setting up data in Tableau Modifying data attributes How Do I Structure my Data – Groups & Hierarchies, Visual Groups How Tableau Deals with Dates – Using Discrete and Continuous Dates, Custom Dates How do I create calculated fields and why? – Creating Calculated Fields, Types of calculated fields, Row Level v Aggregations, Aggregating dimensions in calculations, Changing the Level of Detail (LOD) of calculations – What, Why, How MODULE 3: GATHER REQUIREMENTS(ONLINE CONTENT ONLY) Brainstorm and assess possible priorities Pitfalls to avoid Gather requirements PHASE 2: DEVELOP MODULE 4: CREATE CHARTS Charts that Compare Multiple Measures – Measure Names and Measure Values, Shared Axis Charts, Dual Axis Charts, Scatter Plots Showing progress over time Creating Tables – Creating Tables, Highlight Tables, Heat Maps Showing Relational & Proportional Data – Pie Charts, Donut Charts, Tree Maps Making things dynamic with parameters MODULE 5: COMBINE DATA Relationships Joining Tables – Join Types, Joining tables within the same database, cross database joins, join calculations Blending – How to create a blend with common fields, Custom defined Field relationships and mismatched element names, Calculated fields in blended data sources Unions – Manual Unions and mismatched columns, Wildcard unions Data Extracts – Creating & Editing Data extracts MODULE 6: ANALYSE INFORMATION Table Calculations Sets, Reference Lines, Trends and Forecasting Answering spatial questions – Mapping, Creating a choropleth (filled) map, Using your own images for spatial analysis, Mapping with spatial files Advanced charts Bar in Bar charts Bullet graphs Creating Bins and Histograms Creating a Box & Whisker plot Viz in Tooltips PHASE 3: DESIGN MODULE 7: BUILD DASHBOARDS Using the Dashboard Interface Device layouts Dashboard Actions – Set actions, Parameter actions Viz in Tooltips for Dashboards Dashboard containers – Horizontal & Vertical containers, Hidden containers Navigate between dashboards Telling data driven stories MODULE 8: BRING YOUR OWN DATA Design Best Practices & Resources Wireframe templates Questions Process Start building and testing MODULE 9: EMPOWER STAKEHOLDERS What is Tableau Server Publishing & permissions How can your users engage with content The Tableau ecosystem Review your progress Your next steps HOW MUCH OF YOUR TIME WILL THIS TAKE? Delegates are also provided 6 weeks access to our Tableau Coaching. We run Live Q&A sessions from 4pm-5pm on a Monday (Connecting to Data and Calculated Fields), 2pm-3pm Friday (Creating Charts) & 4pm-5pm Friday (Dashboard Design). The coaching helps delegates to transition from the theory of using Tableau to its practical use. We’d be expecting them to apply the exercises you’ll be doing during the course, onto your own data after the course. In our experience, this is the best way to increase both understanding and long term memory retention. The live coaching also acts as a troubleshooting platform for any practical issues that delegates need to overcome in the real world. Delegates also have 12 months access to all of the training material covered in the course in the form of an online portal (this includes theory videos, exercise solution videos, exercise materials and even quizzes). We have a growing LinkedIn community that delegates are encouraged to join and participate in. We regularly post useful blog posts and additional training that will enhance the Tableau journey and understanding. We help teams using Tableau to transform in the following ways : From a disjointed understanding of Tableau – To being familiar with Tableau terminology and capability From ad-hoc data uploads and error prone calculations – To reusable data connections and robust metrics From disjointed stakeholder questions – To clear and concise requirements that lead to decision making From being unsure how difficult Tableau will be to learn – To being able to develop standard charts and tables in Tableau with dynamic reporting capabilities From manually combining data for each analytical task – To dynamically combining data from multiple tables for analysis From being unsure how to answer analytical questions and what options there are – To being equipped with multiple actionable, dynamic, analytical use cases From not knowing Why, When and How to create Dashboards or Story’s – To being able to combine analysis to answer complex questions and tell data driven stories From using demo data theory – To Delivering value [Answering questions] on their own data From spending lots of time answering colleagues ad-hoc (data) questions – To empowering stakeholders in answering ad-hoc queries and reducing the time to analyse and steer the business
Overview Data and visual analytics are emerging fields concerned with analysing, modelling, and visualizing complex high-dimensional data. It can be analysed and visualised with many languages like Python, R Programming and more. This course will help to attain the skills and give in-depth knowledge to the participant's enhanced way of modelling, analysing and visualizing techniques. The course will highlight practical challenges including composite real-world data and will also comprise several practical studies

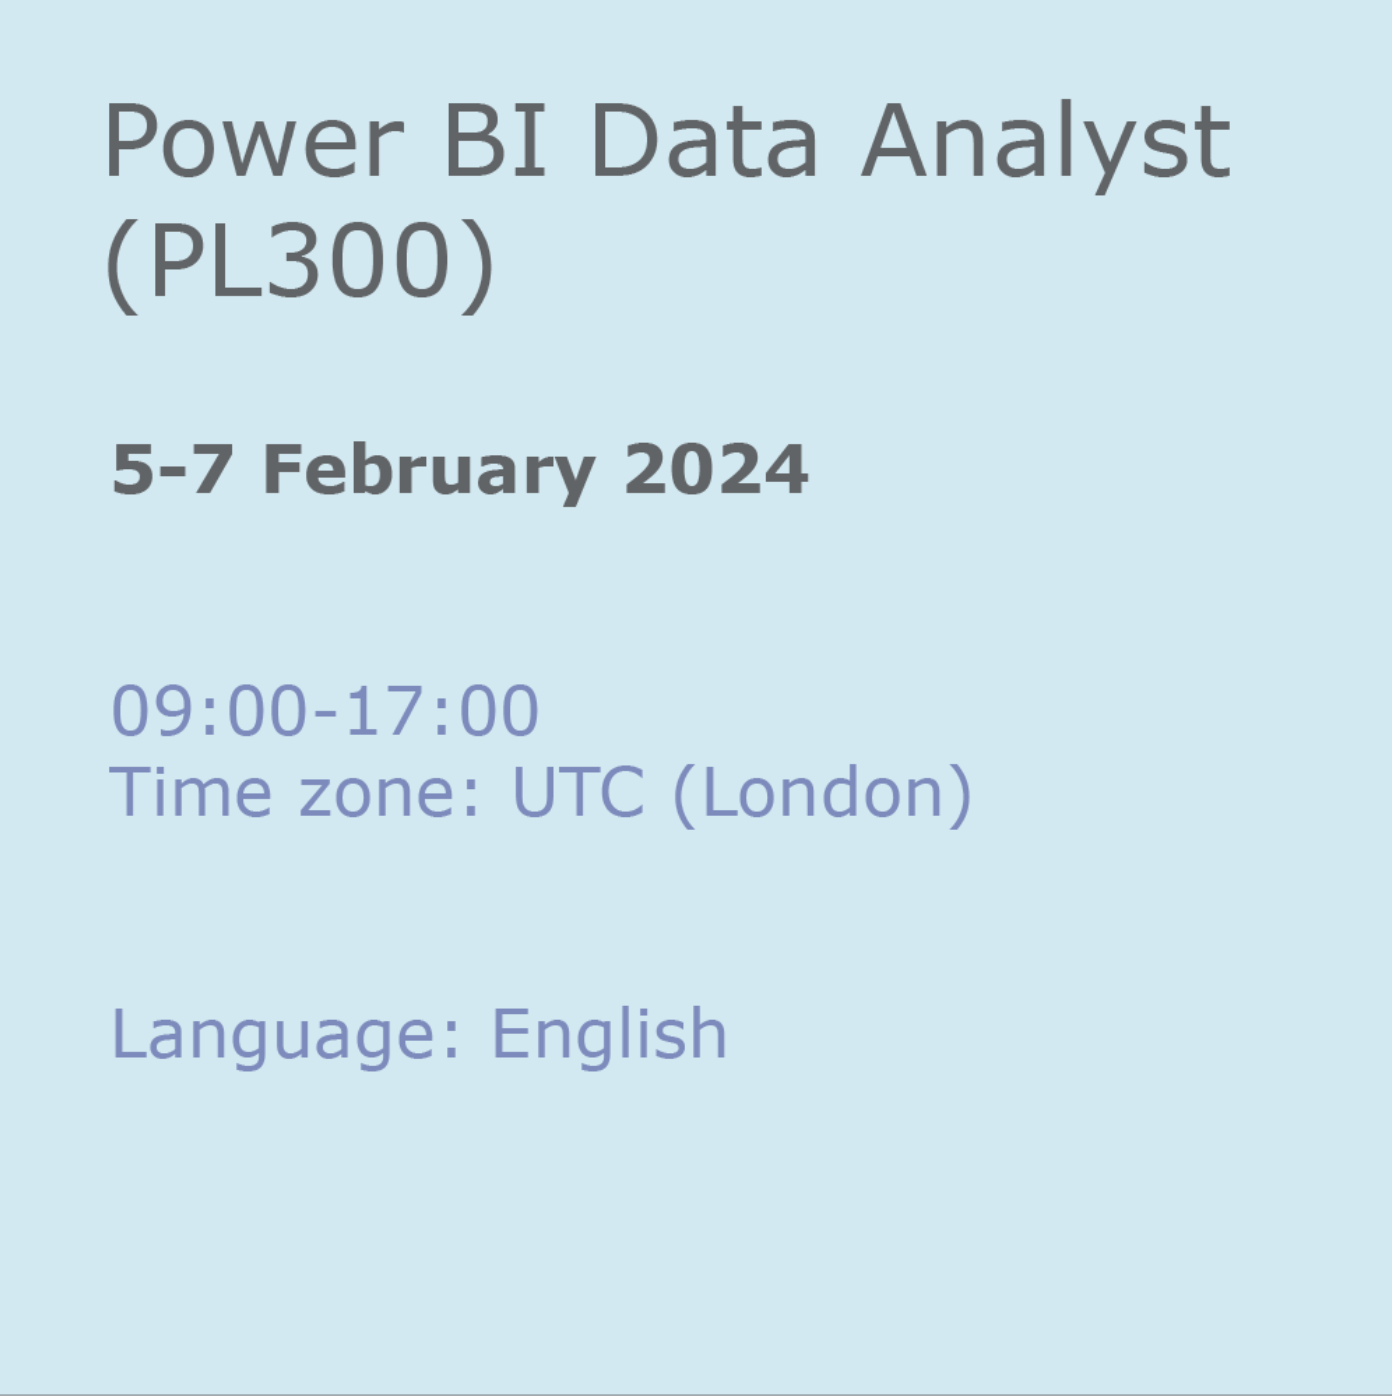
Power BI Data Analyst (PL300)
By Online Productivity Training
OVERVIEW This official Microsoft Power BI training course will teach you how to connect to data from many sources, clean and transform it using Power Query, create a data model consisting of multiple tables connected with relationships and build visualisations and reports to show the patterns in the data. The course will explore formulas created using the DAX language, including the use of advanced date intelligence calculations. Additional visualisation features including interactivity between the elements of a report page are covered as well as parameters and row-level security, which allows a report to be tailored according to who is viewing it. The course will also show how to publish reports and dashboards to a workspace on the Power BI Service. COURSE BENEFITS: Learn how to clean, transform, and load data from many sources Use database queries in Power Query to combine tables using append and merge Create and manage a data model in Power BI consisting of multiple tables connected with relationships Build Measures and other calculations in the DAX language to plot in reports Manage advanced time calculations using date tables Optimise report calculations using the Performance Analyzer Manage and share report assets to the Power BI Service Prepare for the official Microsoft PL-300 exam using Microsoft Official Courseware WHO IS THE COURSE FOR? Data Analysts with little or no experience of Power BI who wish to upgrade their knowledge to include Business Intelligence Management Consultants who need to conduct rapid analysis of their clients’ data to answer specific business questions Analysts who need to upgrade their organisation from a simple Excel or SQL-based management reporting system to a dynamic BI system Data Analysts who wish to develop organisation-wide reporting in the form of web reports or phone apps Marketers in data-intensive organisations who wish to build visually appealing, dynamic charts for their stakeholders to use COURSE OUTLINE Module 1 Getting Started With Microsoft Data Analytics Data analytics and Microsoft Getting Started with Power BI Module 2 Get Data In Power BI Get data from various data sources Optimize performance Resolve data errors Lab: Prepare Data in Power BI Desktop Module 3 Clean, Transform And Load Data In Power BI Data shaping Data profiling Enhance the data structure Lab: Load Data in Power BI Desktop Module 4 Design A Data Model In Power BI Introduction to data modelling Working with Tables Dimensions and Hierarchies Lab: Model Data in Power BI Desktop Module 5 Create Model Calculations Using DAX In Power BI Introduction to DAX Real-time Dashboards Advanced DAX Lab 1: Create DAX Calculations in Power BI Desktop, Part 1 Lab 2: Create DAX Calculations in Power BI Desktop, Part 2 Module 6 Optimize Model Performance Optimize the data model for performance Optimize DirectQuery models Module 7 Create Reports Design a Report Enhance the Report Lab 1: Design a Report in Power BI Desktop, Part 1 Lab 2: Design a Report in Power BI Desktop, Part 2 Module 8 Create Dashboards Create a Dashboard Real-time Dashboards Enhance a Dashboard Lab: Create a Power BI Dashboard Module 9 Perform Advanced Analytics Advanced analytics Data Insights through AI Visuals Lab: Perform Data Analysis in Power BI Desktop Module 10 Create And Manage Workspaces Creating Workspaces Sharing and managing assets Module 11 Manage Datasets In Power BI Parameters Datasets Module 12 Row-Level Security Security in Power BI Lab: Enforce Row-Level Security
Business Analysis Fundamentals: In-House Training
By IIL Europe Ltd
Business Analysis Fundamentals: In-House Training This course is part of IIL's Business Analysis Certificate Program (BACP), a program designed to help prepare individuals to pass the IIBA® Certification exam to become a Certified Business Analysis Professional (CBAP™). This course teaches participants the overall process of business analysis and where it fits in the bigger picture of the project life cycle and the business context. The course is interactive and combines discussion, active workshops, and demonstrations of techniques. The goal is bottom-line results that cut through the real-world problems facing people seeking to improve the way they operate to develop new and improved systems and products or otherwise deliver results through project performance. What you will Learn At the end of this program, you will be able to: Define the solution scope Work with the development team in the systems testing stage Ensure the solution is usable in the business environment Foundation Concepts Defining the business analyst (BA) function The role of the BA as change agent An introduction to the BABOK® Guide BA roles and relationships through the project life cycle (PLC) Business Analysis Planning and Monitoring Overview of business analysis planning and monitoring (BAP&M) Business analysis planning and monitoring - process and tools Business analysis planning and monitoring - roles and responsibilities Business analysis planning and monitoring - governance, information management, and performance improvement Elicitation and Collaboration Overview of elicitation and collaboration Elicitation and collaboration techniques Requirements Life Cycle Management Overview of requirements life cycle management Requirements life cycle management task details Strategy Analysis Overview of strategy analysis Analyze current state Define future state Assess risks Define change strategy Requirements Analysis and Design Definition Overview of requirements analysis and design definition (RA&DD) The anatomy of requirements RA&DD task descriptions RA&DD techniques Solution Evaluation Overview of solution evaluation Solution evaluation tasks Solution evaluation in development stages Underlying Competencies Overview of underlying competencies (UC) Underlying competencies

Overview Objective Understanding the Importance of Business Analysis Model Determining various techniques of Process Modelling Understanding the scope of modelling Efficiently mapping the business landscape Analysing the enterprise structure How to avoid project failures. Learning efficient skills of being a successful business analyst. Understand and document various techniques for the organization delivers value. Successful project conversion Building team, changing the organization and overcoming resistance. Creating an effective Business Case.

Business Analysis Fundamentals: Virtual In-House Training
By IIL Europe Ltd
Business Analysis Fundamentals: Virtual In-House Training This course is part of IIL's Business Analysis Certificate Program (BACP), a program designed to help prepare individuals to pass the IIBA® Certification exam to become a Certified Business Analysis Professional (CBAP™). This course teaches participants the overall process of business analysis and where it fits in the bigger picture of the project life cycle and the business context. The course is interactive and combines discussion, active workshops, and demonstrations of techniques. The goal is bottom-line results that cut through the real-world problems facing people seeking to improve the way they operate to develop new and improved systems and products or otherwise deliver results through project performance. What you will Learn At the end of this program, you will be able to: Define the solution scope Work with the development team in the systems testing stage Ensure the solution is usable in the business environment Foundation Concepts Defining the business analyst (BA) function The role of the BA as change agent An introduction to the BABOK® Guide BA roles and relationships through the project life cycle (PLC) Business Analysis Planning and Monitoring Overview of business analysis planning and monitoring (BAP&M) Business analysis planning and monitoring - process and tools Business analysis planning and monitoring - roles and responsibilities Business analysis planning and monitoring - governance, information management, and performance improvement Elicitation and Collaboration Overview of elicitation and collaboration Elicitation and collaboration techniques Requirements Life Cycle Management Overview of requirements life cycle management Requirements life cycle management task details Strategy Analysis Overview of strategy analysis Analyze current state Define future state Assess risks Define change strategy Requirements Analysis and Design Definition Overview of requirements analysis and design definition (RA&DD) The anatomy of requirements RA&DD task descriptions RA&DD techniques Solution Evaluation Overview of solution evaluation Solution evaluation tasks Solution evaluation in development stages Underlying Competencies Overview of underlying competencies (UC) Underlying competencies
PL300 Revision Day (PL300REV)
By Online Productivity Training
OVERVIEW Prerequisites—this is a day of supervised revision for anyone who wishes to take the PL-300 exam so we expect you to have attended a PL-300 course, either taught or on your own, before attending this day of revision. We are happy for attendees to join the course if you have taken the PL-300 with us or with another provider. In the morning we look at questions from the PL-300 exam, grouped by subject area. For each question we show you the correct answer and then explain why that is the correct answer. After lunch everyone tries a practice exam under exam conditions and we finish the day with clarification on the subjects or specific questions that the class is finding hard. The cost of the course includes a free voucher to take the exam, so please don’t buy your own separately. If you do so we cannot reimburse you with the cost of the exam. COURSE BENEFITS: Discover the parts of the course on which to focus most attention Become familiar with the styles and formats of the exam questions Alert yourself to some of the particularly tricky questions Familiarise yourself with the style of the 'case study' question Practice an exam under real exam conditions Get a feel for the time you need to devote to the normal questions and to the case study WHO IS THE COURSE FOR? Power BI report developers who need PL-300 Certification to apply for a job Business Intelligence specialists who wish to enhance their career prospects with a PL-300 Certification Anyone who wishes to maximise their chances of passing the PL-300 Power BI Data Analyst exam COURSE OUTLINE Module 1 Structure Of The Exam Registration for the exam and setup of your workspace The percentage of marks devoted to each subject area Types of questions used in the exam Advised timing for the normal questions and for the case study question Module 2 Individual Exam Question Practice The exam questions are divided into subject areas and for each question… We consider the question and try to answer it We view the answer Where necessary, we look at an in-depth explanation of why that is the correct answer Examine case study questions and how to treat these differently from the normal questions Module 3 Practice Exam Under Exam Conditions Attendees take a practice exam Attendees receive a mark, broken down into subject areas Module 4 Exam Question Practice Focussed On Tricky Areas Together, based on the results of attendees’ exam results we decide which areas on which to focus More practice on individual exam questions using the same style as in Module 2