- Professional Development
- Medicine & Nursing
- Arts & Crafts
- Health & Wellbeing
- Personal Development
Tableau Desktop Training - Analyst
By Tableau Training Uk
This Tableau Desktop Training intermediate course is designed for the professional who has a solid foundation with Tableau and is looking to take it to the next level. For Private options, online or in-person, please send us details of your requirements: This Tableau Desktop training intermediate course is designed for the professional who has a solid foundation with Tableau and is looking to take it to the next level. Attendees should have a good understanding of the fundamental concepts of building Tableau worksheets and dashboards typically achieved from having attended our Tableau Desktop Foundation Course. At the end of this course you will be able to communicate insights more effectively, enabling your organisation to make better decisions, quickly. The Tableau Desktop Analyst training course is aimed at people who are used to working with MS Excel or other Business Intelligence tools and who have preferably been using Tableau already for basic reporting. The course is split into 3 phases and 9 modules: Phase 1: AMPLIFY MODULE 1: CHECK ABILITIES Revision – What I Should Know What is possibleHow does Tableau deal with dataKnow your way aroundHow do we format chartsHow Tableau deals with datesCharts that compare multiple measuresCreating Tables MODULE 2: COMBINE DATA Relationships Joining Tables – Join Types, Joining tables within the same database, cross database joins, join calculations Blending – How to create a blend with common fields, Custom defined Field relationships and mismatched element names, Calculated fields in blended data sources Unions – Manual Unions and mismatched columns, Wildcard unions Data Extracts – Creating & Editing Data extracts MODULE 3: ADVANCED CALCULATIONS Row Level v Aggregations Aggregating dimensions in calculations Changing the Level of Detail (LOD) of calculations – What, Why, How Adding Table Calculations Phase 2: ANALYSE MODULE 4: EXPAND APPLICATION Making things dynamic with parameters Sets Trend Lines How do we format charts Forecasting MODULE 5: ADVANCED MAPPING Using your own images for spatial analysis Mapping with Spatial files MODULE 6: DATA COMPARISONS Advanced Charts Bar in Bar charts Bullet graphs Creating Bins and Histograms Creating a Box & Whisker plot Phase 3: ACT MODULE 7: ADVANCED DASHBOARDS Using the dashboard interface and Device layout Dashboard Actions and Viz In tooltips Horizontal & Vertical containers Navigate between dashboards MODULE 8: PRESENT STORIES Telling data driven stories MODULE 9: ENABLE DECISIONS What is Tableau Server Publishing & Permissions How can your users engage with content This training course includes over 25 hands-on exercises and quizzes to help participants “learn by doing” and to assist group discussions around real-life use cases. Each attendee receives a login to our extensive training portal which covers the theory, practical applications and use cases, exercises, solutions and quizzes in both written and video format. Students must bring their own laptop with an active version of Tableau Desktop 2018.2 (or later) pre-installed. What People Are Saying About This Course “Course was fantastic, and completely relevant to the work I am doing with Tableau. I particularly liked Steve’s method of teaching and how he applied the course material to ‘real-life’ use-cases.”Richard W., Dashboard Consulting Ltd “This course was extremely useful and excellent value. It helped me formalise my learning and I have taken a lot of useful tips away which will help me in everyday work.” Lauren M., Baillie Gifford “I would definitely recommend taking this course if you have a working knowledge of Tableau. Even the little tips Steve explains will make using Tableau a lot easier. Looking forward to putting what I’ve learned into practice.”Aron F., Grove & Dean “Steve is an excellent teacher and has a vast knowledge of Tableau. I learned a huge amount over the two days that I can immediately apply at work.”John B., Mporium “Steve not only provided a comprehensive explanation of the content of the course, but also allowed time for discussing particular business issues that participants may be facing. That was really useful as part of my learning process.”Juan C., Financial Conduct Authority “Course was fantastic, and completely relevant to the work I am doing with Tableau. I particularly liked Steve’s method of teaching and how he applied the course material to ‘real-life’ use-cases.”Richard W., Dashboard Consulting Ltd “This course was extremely useful and excellent value. It helped me formalise my learning and I have taken a lot of useful tips away which will help me in everyday work.” Lauren M., Baillie Gifford “I would definitely recommend taking this course if you have a working knowledge of Tableau. Even the little tips Steve explains will make using Tableau a lot easier. Looking forward to putting what I’ve learned into practice.”Aron F., Grove & Dean “Steve is an excellent teacher and has a vast knowledge of Tableau. I learned a huge amount over the two days that I can immediately apply at work.”John B., Mporium
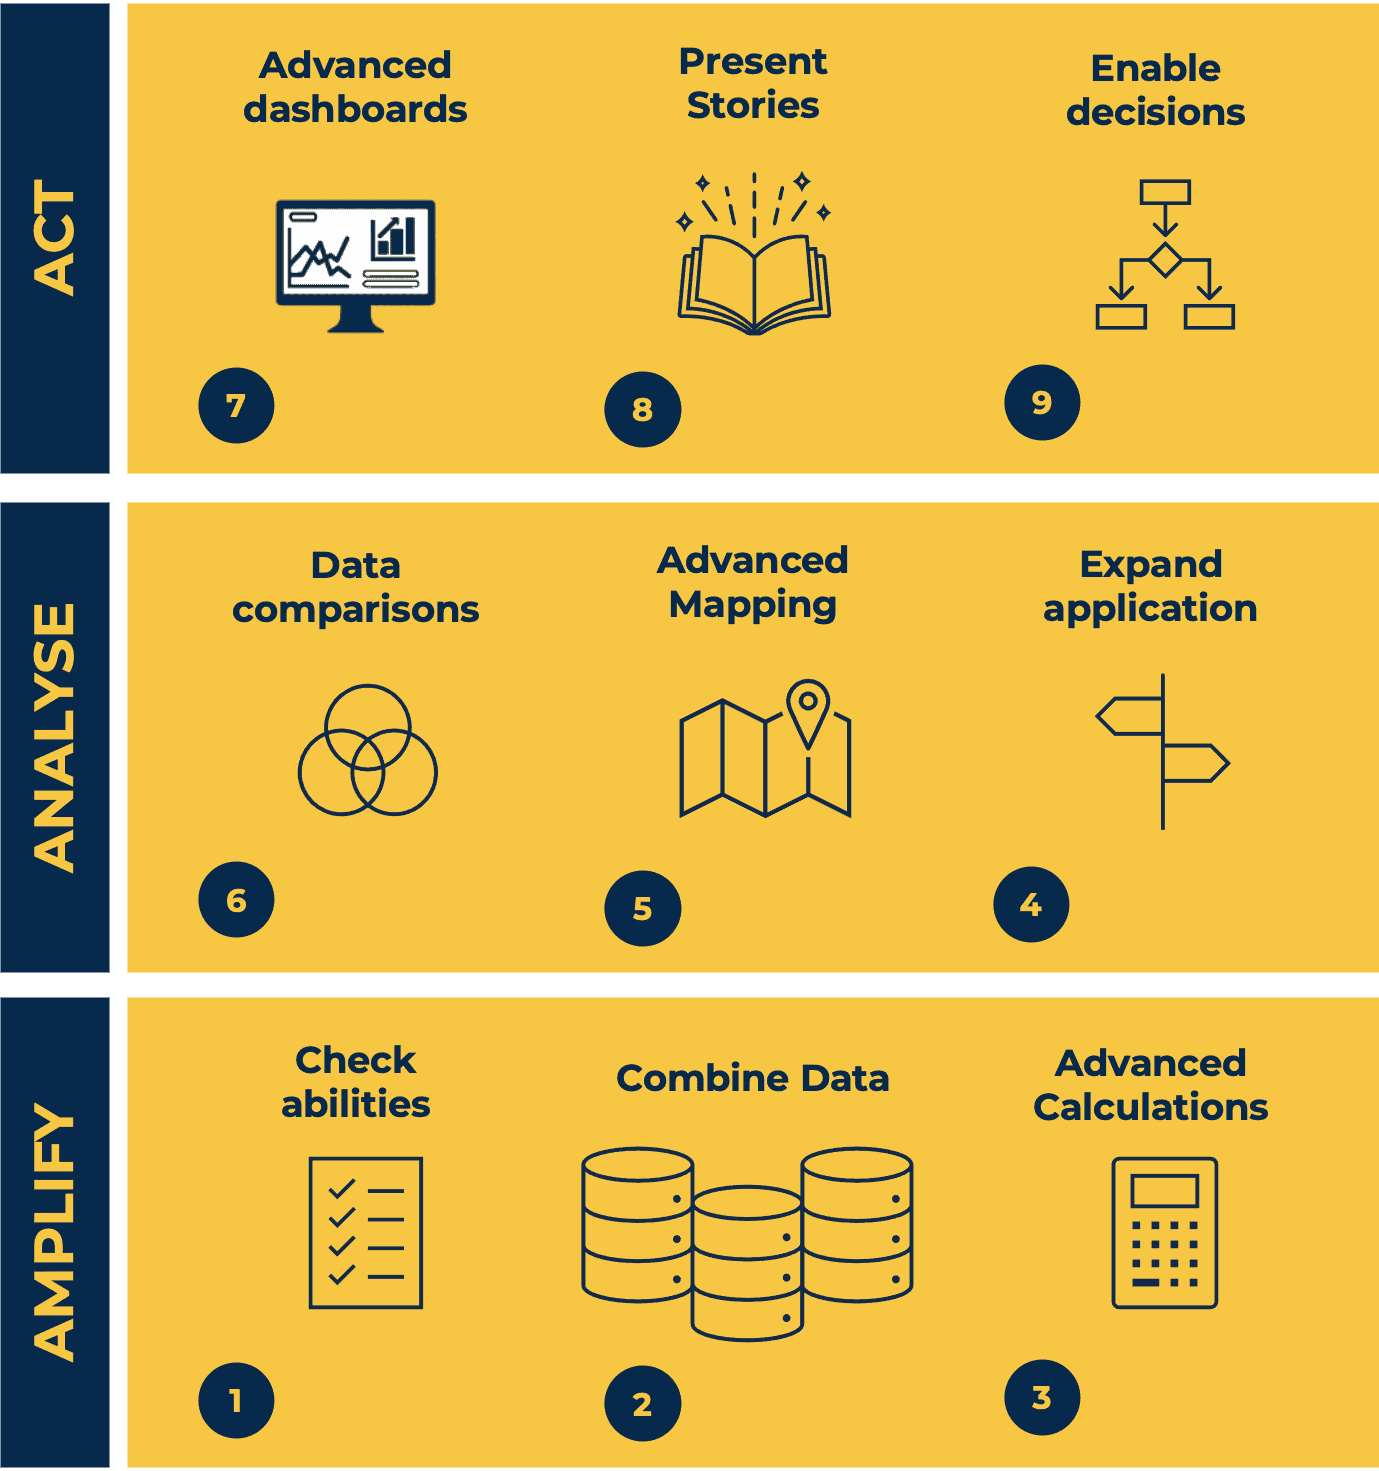
Tableau Desktop Training - Foundation
By Tableau Training Uk
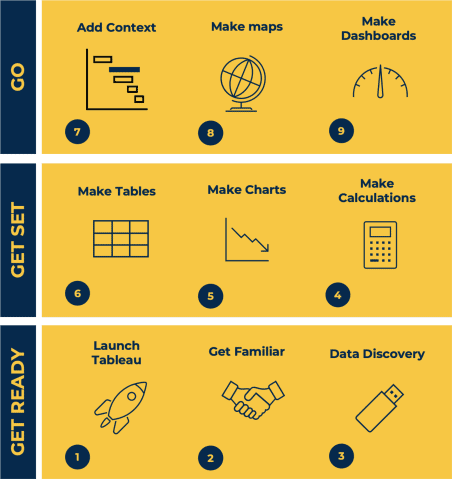
This Tableau Desktop Training course is a jumpstart to getting report writers and analysts with little or no previous knowledge to being productive. It covers everything from connecting to data, through to creating interactive dashboards with a range of visualisations in two days of your time. For Private options, online or in-person, please send us details of your requirements: This Tableau Desktop Training course is a jumpstart to getting report writers and analysts with little or no previous knowledge to being productive. It covers everything from connecting to data, through to creating interactive dashboards with a range of visualisations in two days of your time. Having a quick turnaround from starting to use Tableau, to getting real, actionable insights means that you get a swift return on your investment of time and money. This accelerated approach is key to getting engagement from within your organisation so everyone can immediately see and feel the impact of the data and insights you create. This course is aimed at someone who has not used Tableau in earnest and may be in a functional role, eg. in sales, marketing, finance, operations, business intelligence etc. The course is split into 3 phases and 9 modules: PHASE 1: GET READY MODULE 1: LAUNCH TABLEAU Check Install & Setup Why is Visual Analytics Important MODULE 2: GET FAMILIAR What is possible How does Tableau deal with data Know your way around How do we format charts Dashboard Basics – My First Dashboard MODULE 3: DATA DISCOVERY Connecting to and setting up data in Tableau How Do I Explore my Data – Filters & Sorting How Do I Structure my Data – Groups & Hierarchies, Visual Groups How Tableau Deals with Dates – Using Discrete and Continuous Dates, Custom Dates Phase 2: GET SET MODULE 4: MAKE CALCULATIONS How Do I Create Calculated Fields & Why MODULE 5: MAKE CHARTS Charts that Compare Multiple Measures – Measure Names and Measure Values, Shared Axis Charts, Dual Axis Charts, Scatter Plots Showing Relational & Proportional Data – Pie Charts, Donut Charts, Tree Maps MODULE 6: MAKE TABLES Creating Tables – Creating Tables, Highlight Tables, Heat Maps Phase 3: GO MODULE 7: ADD CONTEXT Reference Lines and Bands MODULE 8: MAKE MAPS Answering Spatial Questions – Mapping, Creating a Choropleth (Filled) Map MODULE 9: MAKE DASHBOARDS Using the Dashboard Interface Dashboard Actions This training course includes over 25 hands-on exercises and quizzes to help participants “learn by doing” and to assist group discussions around real-life use cases. Each attendee receives a login to our extensive training portal which covers the theory, practical applications and use cases, exercises, solutions and quizzes in both written and video format. Students must use their own laptop with an active version of Tableau Desktop 2018.2 (or later) pre-installed. What People Are Saying About This Course “Excellent Trainer – knows his stuff, has done it all in the real world, not just the class room.”Richard L., Intelliflo “Tableau is a complicated and powerful tool. After taking this course, I am confident in what I can do, and how it can help improve my work.”Trevor B., Morrison Utility Services “I would highly recommend this course for Tableau beginners, really easy to follow and keep up with as you are hands on during the course. Trainer really helpful too.”Chelsey H., QVC “He is a natural trainer, patient and very good at explaining in simple terms. He has an excellent knowledge base of the system and an obvious enthusiasm for Tableau, data analysis and the best way to convey results. We had been having difficulties in the business in building financial reports from a data cube and he had solutions for these which have proved to be very useful.”Matthew H., ISS Group
Visual Analytics Best Practice
By Tableau Training Uk
This course is very much a discussion, so be prepared to present and critically analyse your own and class mates work. You will also need to bring a few examples of work you have done in the past. Learning and applying best practice visualisation principles will improve effective discussions amongst decision makers throughout your organisation. As a result more end-users of your dashboards will be able to make better decisions, more quickly. This 2 Day training course is aimed at analysts with good working knowledge of BI tools (we use Tableau to present, but attendees can use their own software such as Power BI or Qlik Sense). It is a great preparation for taking advanced certifications, such as Tableau Certified Professional. Contact us to discuss the Visual Analytics Best Practice course Email us if you are interested in an on-site course, or would be interested in different dates and locations This Tableau Desktop training intermediate course is designed for the professional who has a solid foundation with Tableau and is looking to take it to the next level. Attendees should have a good understanding of the fundamental concepts of building Tableau worksheets and dashboards typically achieved from having attended our Tableau Desktop Foundation Course. At the end of this course you will be able to communicate insights more effectively, enabling your organisation to make better decisions, quickly. The Tableau Desktop Analyst training course is aimed at people who are used to working with MS Excel or other Business Intelligence tools and who have preferably been using Tableau already for basic reporting. The course includes the following topics: WHAT IS VISUAL ANALYSIS? Visual Analytics Visual Analytics Process Advantages of Visual Analysis Exercise: Interpreting Visualisations HOW DO WE PROCESS VISUAL INFORMATION? Memory and Processing Types Exercise: Identifying Types of Processing Cognitive Load Exercise: Analysing Cognitive Load Focus and Guide the Viewer Remove Visual Distractions Organise Information into Chunks Design for Proximity Exercise: Reducing Cognitive Load SENSORY MEMORY Pre-attentive Attributes Quantitatively-Perceived Attributes Categorically-Perceived Attributes Exercise: Analysing Pre-attentive Attributes Form & Attributes Exercise: Using Form Effectively Colour & Attributes Exercise: Using Colour Effectively Position & Attributes Exercise: Using Position Effectively ENSURING VISUAL INTEGRITY Informing without Misleading Gestalt Principles Visual Area Axis & Scale Colour Detail Exercise: Informing without Misleading CHOOSING THE RIGHT VISUALISATION Comparing and Ranking Categories Comparing Measures Comparing Parts to Whole Viewing Data Over Time Charts Types for Mapping Viewing Correlation Viewing Distributions Viewing Specific Values DASHBOARDS AND STORIES Exercise: Picking the Chart Type Exercise: Brainstorming Visual Best Practice Development Process for Dashboards and Stories Plan the Visualisation Create the Visualisation Test the Visualisation Exercise: Designing Dashboards and Stories This training course includes over 20 hands-on exercises to help participants “learn by doing” and to assist group discussions around real-life use cases. Each attendee receives an extensive training manual which covers the theory, practical applications and use cases, exercises and solutions together with a USB with all the materials required for the training. The course starts at 09:30 on the first day and ends at 17:00. On the second day the course starts at 09:00 and ends at 17:00. Students must bring their own laptop with an active version of Tableau Desktop 10.5 (or later) pre-installed. What People Are Saying About This Course "Steve was willing to address questions arising from his content in a full and understandable way"Lisa L. "Really enjoyed the course and feel the subject and the way it was taught was very close to my needs"James G. "The course tutor Steve was incredibly helpful and taught the information very well while making the two days very enjoyable."Bradd P. "The host and his courses will give you the tools and confidence that you need to be comfortable with Tableau."Jack S. "Steve was fantastic with his knowledge and knowhow about the product. Where possible he made sure you could put demonstrations in to working practice, to give the audience a clear understanding."Tim H. "This was a very interesting and helpful course, which will definitely help me produce smarter, cleaner visualisations that will deliver more data-driven insights within our business."Richard A. "Steve is very open to questions and will go out of his way to answer any query. Thank you"Wasif N. "Steve was willing to address questions arising from his content in a full and understandable way"Lisa L. "Really enjoyed the course and feel the subject and the way it was taught was very close to my needs"James G.

Commercial instinct (In-House)
By The In House Training Company
An insightful, enjoyable and experiential programme to help you analyse data and information and make a balanced decision based upon sound commercial reasoning. It will enable you to identify options, make decisions and take actions based on a thorough analysis combined with instinct and intuition to make a positive effect on profitability. This programme will help you: Identify ways to analyse data and sort relevant from irrelevant information Develop analytical and numerate thinking, and consider the financial implications of a decision Make decisions based on sound commercial reasoning - a mix of intuition and analysis Select from a range of tools to analyse a situation and apply these effectively Understand how costs and profits are calculated Use tried-and-tested techniques to manage and control your budgets Appreciate the fundamentals of financial analysis Focus on the bottom line Identify the basics of capital investment appraisal for your business Evaluate results and seek opportunities for improvement to your business 1 The commercial environment What do shareholders and investors want? What do managers want? Profit v non-profit organisations Investor expectations 2 Financial and non-financial information Risk and reward considerations Drivers of commercial decisions 3 Running a business A practical exercise to bring financial statements to life Different stakeholder interests in a business The impact and consequences of decisions on financial statements 4 Where do I make a difference to the organisation? How can I contribute to an improved business performance? Key performance indicators - measuring the right things A 'balanced scorecard' approach - it's not all about money! 5 A 'balanced scorecard' approach Analysing and reviewing my contribution to the business direction What is the current focus of my commercial decisions? Developing the business in the right way - getting the balance right! Where should/could it be in the future? Do my decisions support the overall vision and strategy? 6 Making commercial decisions Left-brain and right-brain thinking Convergent and divergent thinking Analysis and instinct Interactive case study exercise - emotional and rational decisions Reflection - what is my style of making decisions 7 Let's consider the customer! Identifying target markets Differentiating propositions and products Customer service considerations Marketing considerations and initiatives Pricing strategies and considerations 8 Strategic analysis The external environment The internal environment LEPEST analysis SWOT analysis Forecasting Group activity - analysing markets and the competition How do these improve your decisions? 9 Comparing performance Analysing key financial ratios Ways to compare performance and results Break-even analysis 10 Profit and loss accounts and budgeting Managing income and expenditure The budgeting process How does this link to the profit and loss account? Managing and controlling a cost centre/budget The role of the finance department Different ways of budgeting Incremental budgeting Zero-based budgeting 11 Understanding the balance sheet Purpose of balance sheets Understanding and navigating the content What does a balance sheet tell you? How do you affect your balance sheet? Links to the profit and loss account A practical team exercise that brings financial statements to life 12 Business decisions exercise How does this improve your decisions? A practical exercise to apply new knowledge and bring commercial thinking to to life The impact and consequences of decisions on financial statements 13 Working capital Why is this important? The importance of keeping cash flowing Business decisions that affect cash Calculating profit 14 Capital investment appraisal Capex v Opex Payback Return on investment The future value of money The concept of hurdle rate 15 Lessons learned and action planning So what? Recap and consolidation of learning The decisions that I need to consider Actions to achieve my plan

Environmental awareness and management (In-House)
By The In House Training Company
A flexible, modular-based, programme to heighten participants' awareness of ways in which their operations can affect the environment, the principles of environmental management and the practical steps they need to take as individuals and as an organisation to improve environmental performance. Depending on the course modules selected, this programme will give participants: Increased awareness of relevant environmental issues A greater understanding of, and commitment to, the organisation's environmental management programme Preparation for any responsibilities they may have under an Environmental Management System Further benefits according to options chosen 1 Environmental awareness Definition of 'the environment' Key environmental issuesGlobal warmingOzone depletionAcid rainAir qualityWater pollutionContaminated landLand take and green belt shrinkageResource usageHabitat destruction and species extinctions. Option: This module can be used to explain the key environmental issues related to the activities of your own organisation. Diagrams, photos, pictures, examples and statistics relevant to your own organisation are used where possible to illustrate the points being made. 2 Environmental legislation Key elements of environmental legislation affecting the activities of your organisation - including international, European and UK legislation. Legislation of particular relevance to your organisation - how it affects the operations of your organisation Option: Legislation can be dealt with according to which aspect of the environment it protects (eg, air, water, waste) or which part of your organisation's activities it affects Consequences of breaching legislation 3 Environmental management systems Overview of what an environmental management system isHow is an Environmental Management System (EMS) designed and put together?Key elements (emphasising Plan - Do - Check - Review cycle)The need to continually improve Pros and consReasons for having an EMSBenefits of an EMSConsequences of not managing the environmentCosts of installing an EMS Explanation of ISO 14001 and EMAS standards and guidance as applicable to the EMSs of your organisationOverview of your organisation's EMSHow it was set up / is being developed / operatesWho is responsible for itKey parts of system (eg, environmental policy, objectives and targets) identified and discussedEMS documentation - what and where it is. Workshop option: Brainstorm 'Pros and cons' with the participants, come up with all their ideas for good and bad things about EMS and demonstrate that the 'good' list is longer than the 'bad' 4 Environmental consequences Define what an environmental impact is and discuss how they are determined, with reference to the EMS Identify why we want to determine the environmental consequences of operations and activities; how they are used in the EMS for planning, and reducing the impact on the environment Establish key environmental consequences of construction and operational activities on the site; discuss significance ranking and the control measures in place in your organisation. Workshop option: In small groups, participants are asked to identify the impact on the environment of your organisation's activities or a part of their activities. They are then asked to rank these impacts in terms of their significance, using guidelines provided to help them be aware of the contributing factors (eg, frequency, severity). For a selected number of the impacts, the participants are asked to identify what control measures there are and which of these they play a part in. All stages can be discussed with trainers as a whole group at various stages during the workshop. 5 Protected species, nature conservation and invasive weeds Nature conservation, landscape and visual issues in the planning process - overview of key nature UK wildlife legislation, EIA, appropriate timing of surveys, Hedgerow regulations and landscape and visual impact issues Ecological issues - ecological legislation, significant species, hedgerows Archaeology in the development process - why archaeology is important, organisation in the UK, legislation and planning guidance Construction phase issues and consents - major environmental issues during construction, including water resources and land drainage consents, discharges to land or water, water abstraction, public rights of way, tree protection, waste management, Special waste, noise, good practice pollution control and Environmental Audits Identification and management of invasive weeds - including legal position regarding management 6 Chemicals and fuels handling and storage How health and safety management is closely linked to environmental management of materials Planning - what mechanisms are in place for planning materials use; legislation, guidance and policies which define how to manage materials Materials storage - what are the considerations for storing materials, covering:Labels: what are the different types and what do they tell us?Storage facilities: what are the requirements for safe storage of materials (eg, signs, secondary containment, access, segregation, lids/covers)Handling: safe handling for protecting the environment, organisational procedures, high risk situations (eg, decanting, deliveries), how to reduce the risks (eg, use of funnels, proper supervision, training)COSHH and MSDS: brief explanation of legislation and its role in environmental control of hazardous materials, how to use the information provided by COSHH assessments Option: These sessions can be illustrated with photographs/pictures and examples of good and bad storage and handling practices Workshop Options: Labelling Quiz - quick-fire quiz on what different labels tell us; Build a Storage Facility - participants are asked to consider all the environmental requirements for building a safe storage facility for their organisation 7 On-site control measures Overview of the legislation associated with nuisance issues on site and mitigating problems when they arise Examples of bad practice, including fuel storage tanks and mobile equipment - costs involved with prosecution of fuel spills, remediation costs, management costs, legal fees, bad PR coverage Identification and management of contaminated land and relevant legislation Workshop option: Participants are provided with a site plan containing information on site features, environmental conditions and indications of potential issues 8 Waste management Why worry about waste? - a look at how waste disposal can impact on the environment, illustrated by examples of waste-related incidents, statistics on waste production on national, industry-wide and organisational levels, landfill site space, etc Legislation - overview of the relevant legislation, what the main requirements of the regulations are, what penalties there are, and the associated documentation (waste transfer notes) Waste classification - a more in-depth look at how waste is classified under legislation according to hazardous properties, referring to Environment Agency guidance Handling and storage requirements - what are the requirements of the applicable waste legislation and how are they covered by organisational procedures? Examples of good and bad environmental practice associated with handling and storing waste. Workshop option: 'Brown bag' exercise - participants pass round a bag containing tags each with a different waste printed on. They are asked to pick out a tag and identify the classification and the handling, storage and disposal requirements for the waste they select Waste minimisation - overview of the waste minimisation 'ladder' and its different options (elimination, reduction, reuse and recycling), benefits of waste minimisation, examples of waste minimisation techniques Workshop option: Participants are asked to identify opportunities that actually exist within the organisation for minimising production of waste that are not currently being taken advantage of 9 Auditing Requirements for environmental auditing of operations Auditing the EMS Types of internal and external audits Requirements EMS standards (ISO 14001 and EMAS) Carrying out internal audits and being prepared for external audits Workshop options:Mock audit 'Brown Bag' - can be used either for trainers to test participants as if they were in an audit situation, or for the participants to test each other and practice their auditing technique. The bag contains tags each with a different topic printed on (eg, waste skips); participants pass the bag round and select a tag; they are then questioned by the trainer or another participant about that topic as if they were in an audit situation. If the participants are auditing each other, they will be provided with a set of guidelines to keep in mind during the workshop.Virtual auditing - a more practical workshop where participants review photographs of situations/activities relevant to the organisation's operations. They are asked to identify all the good and bad environmental practices that are occurring in the situations. 10 Incident response What should you do when an incident does happen? What should be in a spill kit? When should you call in the experts? When should you inform the Environment Agency or Environmental Health Officer? Workshop option: The participants are provided with some incident scenarios and asked to develop a response to the incident 11 Monitoring and reporting Environmental monitoring programmes and procedures Monitoring and reporting as control measures for environmental consequences Monitoring and environmental 'STOP' card systems - personal and behavioural monitoring and reporting
Negotiation skills (In-House)
By The In House Training Company
Any successful business manager will tell you that you never get the deal you deserve - you always get the deal you negotiate! This two-day workshop includes recent research and practical techniques from the Harvard Business School Negotiation Project and provides a unique opportunity to learn and practice these skills in a safe environment using up to date materials and life-like practice negotiation case studies. This course will help participants to: Understand the basics of negotiation Develop negotiating skills Increase their business acumen Develop their communication skills Learn the models, techniques and tools for an effective negotiation Identify the barriers to agreements Close the deal 1 What is negotiation? Key skills for negotiation Types of negotiation Win-lose negotiations versus Win-win negotiations Wise agreements and Principled Negotiation 2 Four key negotiating concepts BATNA - Best alternative to negotiated agreement Setting your reservation price ZOPA - Zone of possible agreement Creating and trading value 3 Business acumen Understanding pricing, gross margins and profit Knowing the key points on which to negotiate 4 A Four Phase Model for negotiation Nine steps to successful planning Discussing a deal - creating and claiming value Making and framing proposals Bargaining for the winning deal 5 Effective communication Effective questioning Active listening skills Understanding and interpreting body language Barriers to effective communication 6 Understanding influence and persuasion Influencing strategies Ten proven ways to influence people Six universal methods of persuasion Understanding why people do business with other people 7 Negotiating tactics Tactics for win-lose negotiations Tactics for win-win negotiations Effective team negotiating Understanding and using powerv What do you do when the other side has more power? 8 Barriers to agreement Common barriers to agreement The Negotiators Dilemma Dealing with die-hard negotiators Dealing with lack of trust 9 Potential barriers to cross-border agreements Understanding business methods and practice in other cultures Figuring out who has the power and who makes decisions Recognising and dealing with cultural differences What's OK here might not be OK there 10 Closing the deal Four steps to closing the winning deal
Finance for the non-accountant (In-House)
By The In House Training Company
No-one in business will succeed if they are not financially literate - and no business will succeed without financially-literate people. This is the ideal programme for managers and others who don't have a financial qualification or background but who nonetheless need a greater understanding of the financial management disciplines essential to your organisation. This course will give the participants a sound understanding of financial reports, measures and techniques to make them even more effective in their roles. It will enable participants to: Overcome the barrier of the accountants' strange language Deal confidently with financial colleagues Improve their understanding of your organisation's finance function Radically improve their planning and budgeting skills Be much more aware of the impact of their decisions on the profitability of your organisation Enhance their role in the organisation Boost their confidence and career development 1 Review of the principal financial statements What each statement containsOutlineDetail Not just what the statements contain but what they mean Balance sheets and P&L accounts (income statements) Cash flow statements Detailed terminology and interpretation Types of fixed asset - tangible, etc. Working capital, equity, gearing 2 The 'rules' - Accounting Standards, concepts and conventions Fundamental or 'bedrock' accounting concepts Detailed accounting concepts and conventions What depreciation means The importance of stock, inventory and work in progress values Accounting policies that most affect reporting and results The importance of accounting standards and IFRS 3 Where the figures come from Accounting records Assets / liabilities, Income / expenditure General / nominal ledgers Need for internal controls 'Sarbox' and related issues 4 Managing the budget process Have clear objectives, remit, responsibilities and time schedule The business plan Links with corporate strategy The budget cycle Links with company culture Budgeting methods'New' budgetingZero-based budgets Reviewing budgets Responding to the figures The need for appropriate accounting and reporting systems 5 What are costs? How to account for them Cost definitions Full / absorption costing Overheads - overhead allocation or absorption Activity based costing Marginal costing / break-even - use in planning 6 Who does what? A review of what different types of accountant do Financial accounting Management accounting Treasury function Activities and terms 7 How the statements can be interpreted What published accounts contain Analytical review (ratio analysis) Return on capital employed, margins and profitability Making assets work - asset turnover Fixed assets, debtor, stock turnover Responding to figures EBIT, EBITEDIA, eps and other analysts' measure 8 Other key issues Creative accounting Accounting for groups Intangible assets - brand names Company valuations Fixed assets / leased assets / off-balance sheet finance
Advanced financial analysis (In-House)
By The In House Training Company
In today's competitive business world firms are under unprecedented pressure to deliver value to their shareholders and other key stakeholders. Senior executives in all parts of the organisation are finding that they need some degree of financial know how to cope with the responsibility placed on them as business managers and key decision-makers; monitoring and improving business performance, investing in capital projects, mergers and acquisitions: all require some degree of financial knowledge. The key financial skills are not as difficult to learn as many people believe and in the hands of an experienced senior executive they can provide a formidable competitive advantage. After completing this course delegates will be able to: Understand fundamental business finance concepts; understand, analyse and interpret financial statements: Profit Statement, Balance Sheet and Cashflow Statement Understand the vital difference between profit and cashflow; identify the key components of working capital and how they can be managed to generate strong cashflow Evaluate pricing decisions based on an understanding of the nature of business costs and their impact on gross margin and break-even sales; managing pricing, discounts and costs to generate strong business profits; understand how lean manufacturing methods improve profit Use powerful analytical tools to measure and improve the performance of their own company and assess the effectiveness of their competitors Apply and interpret techniques for assessing and comparing investment opportunities in capital projects, business acquisitions and other ventures; understand and apply common methods of business valuation Understand the role of business finance in formulating and implementing competitive business strategy; the role of budgeting as part of the planning process and the various approaches to budgeting and performance measurement 1 Basic principles Delivering value to key stakeholders Accounting concepts, GAAP, IFRS and common terms Understanding and using the balance sheet Understanding and using the profit statement Recognising the vital difference between profit and cashflow Understanding and using the cashflow statement What financial statements can and cannot tell us 2 Managing and improving cashflow Sources of finance and their advantages and disadvantages What is working capital and why is it so important? Managing stocks, debtors and creditors Understanding how working capital drives business growth Understanding and avoiding the over-trading trap Unlocking the funds tied up in fixed assets: asset backed loans and leasing 3 Managing and improving profit Understanding how profits generate cashflow The fundamental nature of costs: fixed and variable business costs Understanding gross margin and break-even How common pricing methods affect gross margin and profit Effective strategies to improve gross margin Using value chain analysis to reduce costs Lean manufacturing methodsUnderstanding Just-in-time, 6 Sigma and Kaizen methods Improving profitEffective and defective strategies 4 Measuring and managing business performance Measures of financial performance and strength Investor behaviour: the risk and reward relationship Return on investment (ROI): the ultimate measure of business performance How profit margin and net asset turnover drive return on net assets Why some companies are more profitable that others Understanding competitive advantage: cost and differentiation advantage Why great companies failWhat happened to Kodak? Using a 'Pyramid of Ratios' to improve business performance Using Critical Success Factors to develop Key Performance Indicators 5 Budgeting and forecasting methods Using budgets to support strategy Objectives and methods for effective budgets Using budgets to monitor and manage business performance Alternative approaches to budgeting Developing and implementing Balanced Scorecards Beyond Budgeting Forecasting methods and techniques Identifying key business drivers Using rolling forecasts and 'what-if' models to aid decision-making
Presentation skills for salespeople (In-House)
By The In House Training Company
We've all sat through far more bad presentations than good ones, but knowing what 'good' looks like is easier than successfully replicating it. Sales presentations are a performance and, as salespeople, fluffing our lines can cost us a lot more than hurt pride. Having discovered and understood the specific needs and burning issues our prospect has, then this course will help any salesperson avoid dropping the ball and instead wowing their prospects with a high-impact, tailored and compelling case for purchase. This course will help participants: Prepare mentally and physically for stand-up presentations Use voice modulation and bullet-pointing to demand attention Avoid boring their prospects Master the do's and don'ts of PowerPoint Deal more effectively with technical hitches and prospect's interruptions Use eye contact and engagement to avoid prospects 'tuning out' Deploy best practice essentials for presenting with colleagues Steer through the toughest Q&A 1 Preparing your presentation Mindset Knowing your objective(s) Vocal warm-up techniques Assembling pre-agreed benefits Time management Room set-up Technical preparation 2 How to open your presentation Vocal energy Summary and agreement of prospect's needs How to have posture and confidence Use of humour What to do with those dreaded hands Confident v non-confident body language 3 How to get and keep people's attention Bullet pointing Linking benefits to specific, stated needs Practical exercise - formulating and delivering tailored benefits Being selective with features Third party reinforcement and case studies 'Watering the garden' eye contact technique Practical exercise - participants practise 'sharing out' eye contact to audience How to handle a prospect's negative body language Handling interruptions 4 Presenting in groups Credentialing all participants Role delineation for group presentations Edifying other participants' messages - do's and don'ts How to maintain energy when not speaking Practical exercise - good and bad practice when not speaking Teamwork in Q&A sessions How to hand over professionally 5 PowerPoint do's and don'ts Use of visual aids Good and bad PowerPoint slides How to make PowerPoint work for you Classic PowerPoint errors Avoiding and handling technical problems Good and bad flipchart practice 6 Closing and / or achieving next action steps Power of summary Good Q&A practice Handling objections Practical exercise - handling objections on one's feet Creating consensus among prospect panel What to do when prospects disagree with each other When to trial close How to close on next action steps 7 Wrap-up Key learning points from each participant Action steps to be implemented on next presentations
The Sales Accelerator (In-House)
By The In House Training Company
The Sales Accelerator programme is a fresh approach to improving business development productivity. It focuses on identifying and using a series of business productivity metrics in order to build a clear action plan for improving sales results - typically within 90 days. The metrics are grouped under three headings: The basic principle is that a small improvement in each area can lead to a significant increase in sales results and productivity. And the object of the programme is to show how best to achieve that. The programme therefore looks at each of these three areas in turn, spending a day on each. Suitable for any and all businesses and all levels of experience and expertise, this is a remarkably practical and hands-on programme. During the workshop, participants discuss, review and apply many proven sales and marketing techniques and personal selling ideas. The goal is to generate and commit to changes and actions that can lead to a 10-30% increase in the next three to six months. There's also a consultancy option, rather than the workshop-based programme. See below for details. Day one - Activity Key objective This first module introduces the Sales Accelerator model. The goal here is to show participants how to increase their pro-active activity levels by around 10%. It covers all aspects of creating new business opportunities, from existing customers and non-customers alike, and is linked to personal activity improvement goals. Main elements Improve the productivity, accuracy and effectiveness of your business approach by using new and unique models and techniques. Different methods of creating and generating new business opportunities in the short, medium and long term. This includes sourcing new business, up-selling, cross-selling, warm calling and gaining referrals. Using organised persistence to track and build new customer revenue. Managing your sales time effectively. Key learning points Sales productivity - understand the dynamics of increasing the combination of activity levels, deal value and conversion rate of proposals/quotations to orders and implement an improvement plan. Sales goal setting: setting business development objectives for quantity and quality - plus tips and tricks of top performers. Maintain a peak activity level, on a consistent basis using 'organised persistence' and structured business development tracking methodology. How to prioritise opportunities and manage your time when sourcing new business. Identify potential new customers - and particularly the decision-makers and influencers - with greater accuracy. Make outbound business or appointment calls with improved confidence, control and results. Day two - Value Key objective To be able to better anticipate, identify, create, and develop business opportunities using a customer / client-focused communication-based business model and consultative skills. Main elements How to develop sales more effectively from new and existing customers; and managing the first appointment with a new customer. Use structured and assertive drawing-out skills to identify, develop and formalise business opportunities and to gain commitment. How to better position your company and your products and services against your main competitors. Create and deliver persuasive business messages based on specific need areas, criteria and value. Key learning points Advanced consultative selling - use a variety of structured and advanced questioning techniques to confidently and efficiently uncover opportunities, need areas and business criteria - confidently and efficiently. Involve the customer/client at all times, and to a far greater degree, and keep better control of business development process. Value message - differentiate your solutions clearly and accurately with customer/client-matched value statements. Presenting the right USPs, features and benefits and making them relevant and real to the customer. Qualification and reading buying signals. Day three (held around four weeks after the first module) - Conversion Key objective This module looks at how to improve the final qualification, progression and conversion of opportunities in your sales pipeline. Also includes price negotiation, overcoming objections and obstacles to gaining agreement. The module begins with a learning review, sharing participants' experiences over the last four weeks in applying the new techniques and skills acquired during the first two modules. This is an opportunity to revisit particularly challenging areas as well as to share and celebrate successes. Main elements Structuring and preparing for negotiating a deal and knowing when and how to move into the 'end-game' mode. Anticipate and answer customer objections and questions more confidently. Build more credibility and proof into your business process to reduce 'buyer's remorse' and speed-up decision-making. Being more assertive and developing better instincts and strategic thinking in progressing quotations and proposals. Key learning points Smart ways to position price, emphasise value and be a strong player without being the cheapest. Becoming more assertive in closing deals, and the importance of organised follow-up on the telephone. Qualify pipeline opportunities with more accuracy, using a proven check-list. Use an 'option generator' to simplify complex proposals, increase business value and close business faster. Writing more effective sales proposal documents and quotations. How best to draw-out, understand, isolate and answer customer objections, negotiate points and concerns. Practical methods of asking for agreement and closing a sale