- Professional Development
- Medicine & Nursing
- Arts & Crafts
- Health & Wellbeing
- Personal Development


Courses matching "Analytics"
Show all 106
Master Business Networking in Just 1 Day - Join our Workshop in London
By Mangates
Business Networking 1 Day Training in London

Assessment Based Training - Python Programming & Analytics for the Oil & Gas Sector - Maximising Value from Data Assets
By EnergyEdge - Training for a Sustainable Energy Future
Maximize the value of data assets in the oil and gas sector with EnergyEdge's assessment-based training course on Python programming and analytics.

PYTHON BOOTCAMP: This 12-week Python Data Analytics Data Boot Camp is designed to give you a complete skill set required by data analysts . You will be fully fluent and confident as a Python data analyst, with full understanding of Python Programming. From Data, databases, datasets, importing, cleaning, transforming, analysing to visualisation and creating awesome dashboards The course is a practical, instructor-lead program.
Overview Data and visual analytics are emerging fields concerned with analysing, modelling, and visualizing complex high-dimensional data. It can be analysed and visualised with many languages like Python, R Programming and more. This course will help to attain the skills and give in-depth knowledge to the participant's enhanced way of modelling, analysing and visualizing techniques. The course will highlight practical challenges including composite real-world data and will also comprise several practical studies

Practical Sales Skills 1 Day Workshop in Bromley
By Mangates
Practical Sales Skills 1 Day Workshop in Bromley

Practical Sales Skills 1 Day Workshop in Heathrow
By Mangates
Practical Sales Skills 1 Day Workshop in Heathrow
Visual Analytics Best Practice
By Tableau Training Uk
This course is very much a discussion, so be prepared to present and critically analyse your own and class mates work. You will also need to bring a few examples of work you have done in the past. Learning and applying best practice visualisation principles will improve effective discussions amongst decision makers throughout your organisation. As a result more end-users of your dashboards will be able to make better decisions, more quickly. This 2 Day training course is aimed at analysts with good working knowledge of BI tools (we use Tableau to present, but attendees can use their own software such as Power BI or Qlik Sense). It is a great preparation for taking advanced certifications, such as Tableau Certified Professional. Contact us to discuss the Visual Analytics Best Practice course Email us if you are interested in an on-site course, or would be interested in different dates and locations This Tableau Desktop training intermediate course is designed for the professional who has a solid foundation with Tableau and is looking to take it to the next level. Attendees should have a good understanding of the fundamental concepts of building Tableau worksheets and dashboards typically achieved from having attended our Tableau Desktop Foundation Course. At the end of this course you will be able to communicate insights more effectively, enabling your organisation to make better decisions, quickly. The Tableau Desktop Analyst training course is aimed at people who are used to working with MS Excel or other Business Intelligence tools and who have preferably been using Tableau already for basic reporting. The course includes the following topics: WHAT IS VISUAL ANALYSIS? Visual Analytics Visual Analytics Process Advantages of Visual Analysis Exercise: Interpreting Visualisations HOW DO WE PROCESS VISUAL INFORMATION? Memory and Processing Types Exercise: Identifying Types of Processing Cognitive Load Exercise: Analysing Cognitive Load Focus and Guide the Viewer Remove Visual Distractions Organise Information into Chunks Design for Proximity Exercise: Reducing Cognitive Load SENSORY MEMORY Pre-attentive Attributes Quantitatively-Perceived Attributes Categorically-Perceived Attributes Exercise: Analysing Pre-attentive Attributes Form & Attributes Exercise: Using Form Effectively Colour & Attributes Exercise: Using Colour Effectively Position & Attributes Exercise: Using Position Effectively ENSURING VISUAL INTEGRITY Informing without Misleading Gestalt Principles Visual Area Axis & Scale Colour Detail Exercise: Informing without Misleading CHOOSING THE RIGHT VISUALISATION Comparing and Ranking Categories Comparing Measures Comparing Parts to Whole Viewing Data Over Time Charts Types for Mapping Viewing Correlation Viewing Distributions Viewing Specific Values DASHBOARDS AND STORIES Exercise: Picking the Chart Type Exercise: Brainstorming Visual Best Practice Development Process for Dashboards and Stories Plan the Visualisation Create the Visualisation Test the Visualisation Exercise: Designing Dashboards and Stories This training course includes over 20 hands-on exercises to help participants “learn by doing” and to assist group discussions around real-life use cases. Each attendee receives an extensive training manual which covers the theory, practical applications and use cases, exercises and solutions together with a USB with all the materials required for the training. The course starts at 09:30 on the first day and ends at 17:00. On the second day the course starts at 09:00 and ends at 17:00. Students must bring their own laptop with an active version of Tableau Desktop 10.5 (or later) pre-installed. What People Are Saying About This Course "Steve was willing to address questions arising from his content in a full and understandable way"Lisa L. "Really enjoyed the course and feel the subject and the way it was taught was very close to my needs"James G. "The course tutor Steve was incredibly helpful and taught the information very well while making the two days very enjoyable."Bradd P. "The host and his courses will give you the tools and confidence that you need to be comfortable with Tableau."Jack S. "Steve was fantastic with his knowledge and knowhow about the product. Where possible he made sure you could put demonstrations in to working practice, to give the audience a clear understanding."Tim H. "This was a very interesting and helpful course, which will definitely help me produce smarter, cleaner visualisations that will deliver more data-driven insights within our business."Richard A. "Steve is very open to questions and will go out of his way to answer any query. Thank you"Wasif N. "Steve was willing to address questions arising from his content in a full and understandable way"Lisa L. "Really enjoyed the course and feel the subject and the way it was taught was very close to my needs"James G.

Data Analytics Workflows for Artificial Lift, Production and Facility Engineers
By EnergyEdge - Training for a Sustainable Energy Future
About this training course Business Impact: The main aim is to provide insight and understanding of data analytics and machine learning principles through applications. Field data is used to explain data-analysis workflows. Using easy to follow solution scripts, the participants will assess and extract value from the data sets. Hands-on solution approach will give them confidence to try out applicable techniques on data from their field assets. Data analysis means cleaning, inspecting, transforming, and modeling data with the goal of discovering new, useful information and supporting decision-making. In this hands-on 2-day training course, the participants learn some data analysis and data science techniques and workflows applied to petroleum production (specifically artificial lift) while reviewing code and practicing. The focus is on developing data-driven models while keeping our feet closer to the underlying oil and gas production principles. Unique Features: Eight business use cases covering their business impact, code walkthroughs for most all and solution approach. Industry data sets for participants to practice on and take home. No software or complicated Python frameworks required. Training Objectives After the completion of this training course, participants will be able to: Understand digital oil field transformation and its impact on business Examine machine learning methods Review workflows and code implementations After completing the course, participants will have a set of tools and some pathways to model and analyze their data in the cloud, find trends, and develop data-driven models Target Audience This training course is suitable and will greatly benefit the following specific groups: Artificial lift, production and facilities engineers and students to enhance their knowledge base, increase technology awareness, and improve the facility with different data analysis techniques applied on large data sets Course Level Intermediate Advanced Training Methods The course discusses several business use-cases that are amenable to data-driven workflows. For each use case, the instructor will show the solution using a data analysis technique with Python code deployed in the Google cloud. Trainees will solve a problem and tweak their solution. Course Duration: 2 days in total (14 hours). Training Schedule 0830 - Registration 0900 - Start of training 1030 - Morning Break 1045 - Training recommences 1230 - Lunch Break 1330 - Training recommences 1515 - Evening break 1530 - Training recommences 1700 - End of Training The maximum number of participants allowed for this training course is 20. This course is also available through our Virtual Instructor Led Training (VILT) format. Prerequisites: Understanding of petroleum production concepts Knowledge of Python is not a must but preferred to get the full benefit. The training will use the Google Collaboratory environment available in Google-Cloud for hands-on exercises Trainees will need to bring a computer with a Google Chrome browser and a Google email account (available for free) Trainer Your expert course leader has over 35 years' work-experience in multiphase flow, artificial lift, real-time production optimization and software development/management. His current work is focused on a variety of use cases like failure prediction, virtual flow rate determination, wellhead integrity surveillance, corrosion, equipment maintenance, DTS/DAS interpretation. He has worked for national oil companies, majors, independents, and service providers globally. He has multiple patents and has delivered a multitude of industry presentations. Twice selected as an SPE distinguished lecturer, he also volunteers on SPE committees. He holds a Bachelor's and Master's in chemical engineering from the Gujarat University and IIT-Kanpur, India; and a Ph.D. in Petroleum Engineering from the University of Tulsa, USA. Highlighted Work Experience: At Weatherford, consulted with clients as well as directed teams on digital oilfield solutions including LOWIS - a solution that was underneath the production operations of Chevron and Occidental Petroleum across the globe. Worked with and consulted on equipment's like field controllers, VSDs, downhole permanent gauges, multiphase flow meters, fibre optics-based measurements. Shepherded an enterprise-class solution that is being deployed at a major oil and gas producer for production management including artificial lift optimization using real time data and deep-learning data analytics. Developed a workshop on digital oilfield approaches for production engineers. Patents: Principal inventor: 'Smarter Slug Flow Conditioning and Control' Co-inventor: 'Technique for Production Enhancement with Downhole Monitoring of Artificially Lifted Wells' Co-inventor: 'Wellbore real-time monitoring and analysis of fracture contribution' Worldwide Experience in Training / Seminar / Workshop Deliveries: Besides delivering several SPE webinars, ALRDC and SPE trainings globally, he has taught artificial lift at Texas Tech, Missouri S&T, Louisiana State, U of Southern California, and U of Houston. He has conducted seminars, bespoke trainings / workshops globally for practicing professionals: Companies: Basra Oil Company, ConocoPhillips, Chevron, EcoPetrol, Equinor, KOC, ONGC, LukOil, PDO, PDVSA, PEMEX, Petronas, Repsol, , Saudi Aramco, Shell, Sonatrech, QP, Tatneft, YPF, and others. Countries: USA, Algeria, Argentina, Bahrain, Brazil, Canada, China, Croatia, Congo, Ghana, India, Indonesia, Iraq, Kazakhstan, Kenya, Kuwait, Libya, Malaysia, Oman, Mexico, Norway, Qatar, Romania, Russia, Serbia, Saudi Arabia, S Korea, Tanzania, Thailand, Tunisia, Turkmenistan, UAE, Ukraine, Uzbekistan, Venezuela. Virtual training provided for PetroEdge, ALRDC, School of Mines, Repsol, UEP-Pakistan, and others since pandemic. POST TRAINING COACHING SUPPORT (OPTIONAL) To further optimise your learning experience from our courses, we also offer individualized 'One to One' coaching support for 2 hours post training. We can help improve your competence in your chosen area of interest, based on your learning needs and available hours. This is a great opportunity to improve your capability and confidence in a particular area of expertise. It will be delivered over a secure video conference call by one of our senior trainers. They will work with you to create a tailor-made coaching program that will help you achieve your goals faster. Request for further information post training support and fees applicable Accreditions And Affliations

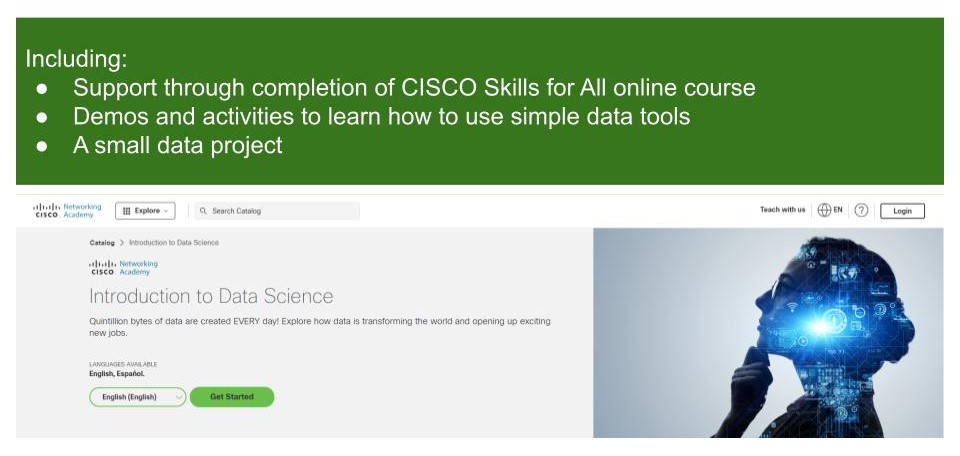
Introduction to Data Science
By futureCoders SE
Learn the basics of Data Science, combining a supported #CISCO Skills for All online course with practical learning and a project to help consolidate the learning.