- Professional Development
- Medicine & Nursing
- Arts & Crafts
- Health & Wellbeing
- Personal Development
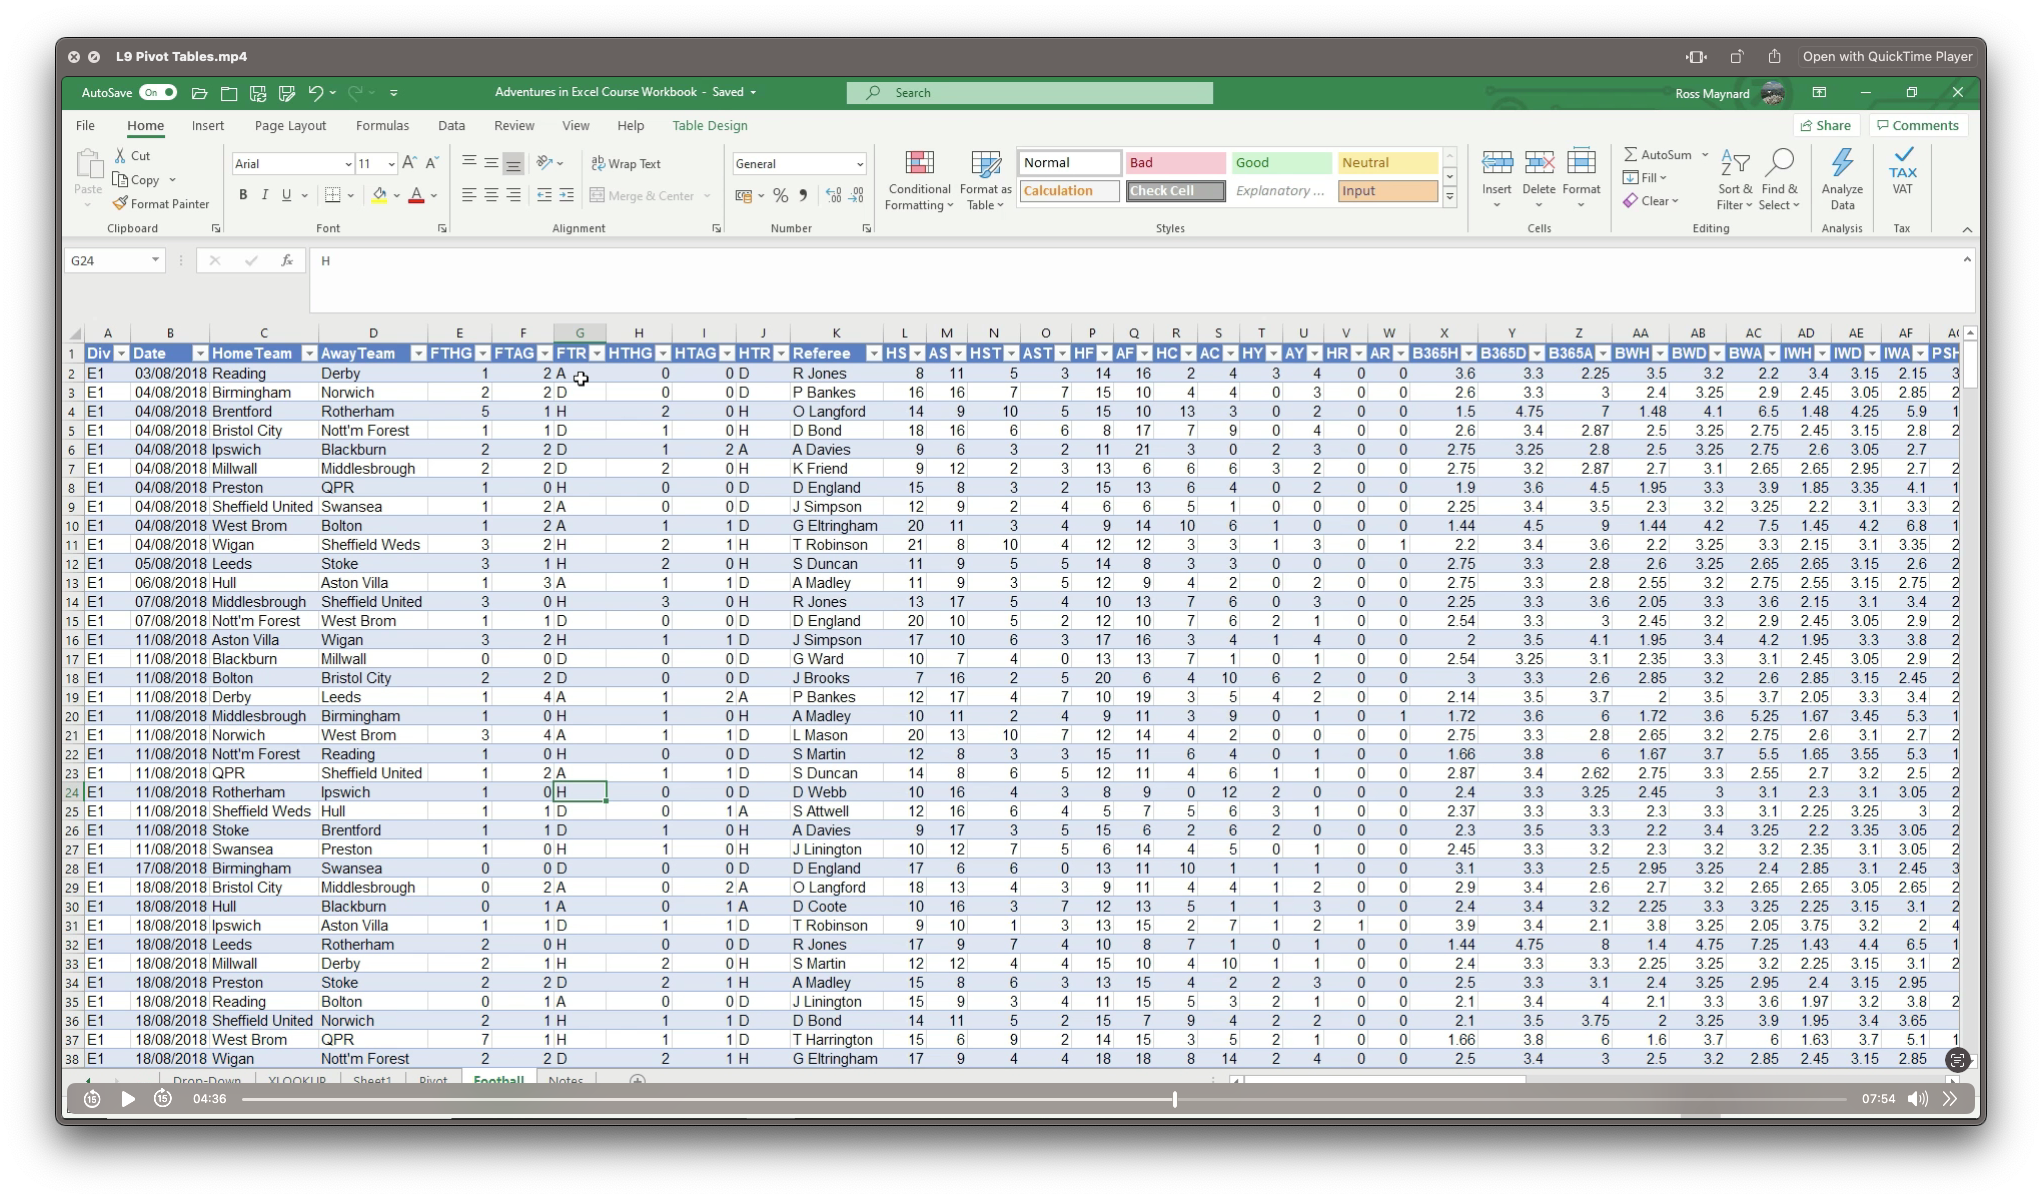
Adventures in Excel
By Ideas Into Action
Description Microsoft Excel has hundreds, if not thousands, of functions and features. This course aims to cover some of the best – that is the ones I find most useful. In “Adventures in Excel”, I cover the simple-to-use but powerful functions that I use most often: Basic features including products and powers Key date functions including the calculation of due dates and days past due Generating random numbers and random dates The new IFS functions (new to Office365) Text functions The most useful logical functions and IS functions How to create a drop-down list The new XLOOKUP function Pivot tables These functions are easy to use, and, unless your role is extremely specialised, they are probably the ones you’ll use 90% of the time. I hope you find the course helpful. Learning Outcomes Participants in this course will learn: Basic Excel functions including SUM, AVERAGE, MIN, MAX, PRODUCT, POWER and SQRT Useful date functions including TODAY, EOMONTH, EDATE, and DAYS Generating random numbers using RAND and RANDBETWEEN; generating random dates; and randomly picking an item from a list or table The new RANDARRAY function in Office365 The new IFS functions in Office365 including AVERAGEIFS, MAXIFS, MINIFS, COUNTIFS, and SUMIFS Text functions including TRIM, LOWER, UPPER, PROPER, LEFT, MID, RIGHT, FIND, TEXTJOIN and CONCATENATE Logical functions AND, OR, and NOT and IS functions ISTEXT, ISNUMBER, ISBLANK and ISERROR How to create a drop-down list The new SORT and FILTER functions in Office365 VLOOKUP and the new XLOOKUP function How to create a Pivot table and analyse data with one Course Requirements There are no pre-course requirements. Additional Resources Course Spreadsheet with the examples covered. About Ross Ross Maynard is a Fellow of the Chartered Institute of Management Accountants in the UK. He is director of Ideas2Action Process Excellence Ltd and has 30 years’ experience as a process improvement consultant and facilitator. Ross is also a professional author of online training courses for accountants. Ross lives in Scotland with his wife, daughter and Cocker Spaniel
Excel - Excel Essentials and Formulas
By Nexus Human
Duration 1 Days 6 CPD hours This course is intended for To ensure success, students will need to be familiar with using personal computers and should have experience using a keyboard and mouse. Students should also be comfortable working in the Windows environment and be able to manage information on their computers. Overview Upon successful completion of this course, you will be able to create and develop Excel worksheets and workbooks in order to work with and analyse the data that is critical to the success of your organisation. This course is intended for those who wish to gain the foundational understanding of Excel that is necessary to create and work with electronic spreadsheets. Excel can help you organise, calculate, analyse, revise, update, and present your data. Getting Started with Excel Navigate the Excel User Interface Use Excel Commands Create and Save a Basic Workbook Enter and Edit Cell Data Fill Cells with Series of Data (AutoFill and Flash Fill) Use Excel Help Performing Calculations Create Worksheet Formulas Insert Functions and use Autocomplete Reuse Formulas and Functions Create an Absolute Reference Modifying a Worksheet Insert, Delete, and Adjust Cells, Columns, and Rows Move and Copy Data between Cells Search for and Replace Data Use Spellcheck and Proofing Formatting a Worksheet Apply Text Formats Apply Number Formats Align Cell Contents Apply and Copy Cell Styles Apply Basic Conditional Formatting Printing Workbooks Preview and Print a Workbook Controlling Page Layout Adding Headers and Footers Set Print Titles and Print Ranges Managing Workbooks Manage Worksheets Insert and Delete Worksheets Manage Workbook and Worksheet Views Manage Workbook Properties

Tableau Prep Building (Tableau Data Prep) for Experienced Users (TTDTAB010)
By Nexus Human
Duration 2 Days 12 CPD hours This course is intended for This is an Intermediate and beyond-level Tableau course geared for experienced Tableau users who wish to leverage Tableau's more advanced capabilities. Overview This skills-focused course combines expert lecture, real-world demonstrations and group discussions with machine-based practical labs and exercises. Working in a hands-on learning environment led by our expert facilitator, students will learn how to: Understand what data works best with Tableau Desktop and how to shape and clean it appropriately to get Learn how to maximize flexibility from Tableau Desktop. Learn how Tableau Prep folds into the analytic cycle, and when to prep data in Tableau Prep vs. Tableau Desktop. Understand the terminology used in Tableau Prep. Know how Tableau Prep approaches data sampling. Create and understand data prep flows that address common scenarios encountered in data preparation, as applied to common data use cases Know how to view data prepared in Tableau Prep using Tableau Desktop. Understand data exploration and validation in Tableau Prep and Tableau Desktop. Geared for experienced Tableau Users, Tableau Prep Building (Tableau Data Prep) for Experienced Users is a two-day hands-on course designed to provide you with the tools and knowledge of how to prepare and shape data in Tableau Prep. It?s best suited for people who have 3-6 months experience in Tableau Desktop and are somewhat familiar with writing calculations. Throughout the course, our instructors will take you from conceptual data preparation material to creating useful Tableau Prep flows that can be output to Tableau Desktop for analysisNOTE: The Tableau Training Series is independent-format training that can be tuned and adjusted to best meet your needs. Our materials are flexible, comprehensive, and are always instructed by a senior instructor with a deep understanding of Tableau and its most current features, benefits and functionality in a wide array of uses. This is not Official Tableau Training. Course Outline Introduction to the workspace Introduction to the workflow Data literacy concepts Connecting to and configuring data Exploring data Cleaning data Preferred data structures in Tableau Shaping data Combining data Opening a data sample and creating an output file Best practices for data preparation Complex flows Starting with a question Hands-on data preparation Additional course details: Nexus Humans Tableau Prep Building (Tableau Data Prep) for Experienced Users (TTDTAB010) training program is a workshop that presents an invigorating mix of sessions, lessons, and masterclasses meticulously crafted to propel your learning expedition forward. This immersive bootcamp-style experience boasts interactive lectures, hands-on labs, and collaborative hackathons, all strategically designed to fortify fundamental concepts. Guided by seasoned coaches, each session offers priceless insights and practical skills crucial for honing your expertise. Whether you're stepping into the realm of professional skills or a seasoned professional, this comprehensive course ensures you're equipped with the knowledge and prowess necessary for success. While we feel this is the best course for the Tableau Prep Building (Tableau Data Prep) for Experienced Users (TTDTAB010) course and one of our Top 10 we encourage you to read the course outline to make sure it is the right content for you. Additionally, private sessions, closed classes or dedicated events are available both live online and at our training centres in Dublin and London, as well as at your offices anywhere in the UK, Ireland or across EMEA.
Excel - Automating Excel with Macros and Analysis Tools
By Nexus Human
Duration 1 Days 6 CPD hours This course is intended for To ensure success, students should have completed Excel Essentials and Excel Functions Including Pivot Tables and Lookups or have the equivalent knowledge and experience. Overview Upon successful completion of this course, students will be able to enhance productivity and efficiency by streamlining workflow, collaborate with others, and audit and analyse data. This course is designed for students desiring to gain skills necessary to create macros, collaborate with others, audit and analyse data, incorporate multiple data sources, and import data. Working with Multiple Worksheets and Workbooks Working with Named Ranges Link Cells Across Worksheets and Workbooks Use 3D References to Calculate Across Worksheets Consolidate Data Use Formula Auditing and Error Checking Reveal Formulas Trace Cell Precedents and Dependents Locate Errors in Formulas Watch and Evaluate Formulas Reviewing and Protecting Workbooks Control Data Entry via Data Validation Protect Workbook Access Protect Worksheets and Cell Content Add and Edit Comments Prepare a Workbook for Distribution Modify Excel's Default Settings Using Macros to Automate Workbook Functionality Create Macros via Recording Run Macros via Buttons and Shortcuts Assign Macros to the Quick Access Toolbar and Ribbon Assign Macros to Objects View Macro Code Forecasting and Analysis Data Use Conditional Formatting to Highlight, Sort and Filter Key Data Advanced Conditional Formatting using Formulas Create Sparklines to Visualise Data Add Trendlines to Charts to Visualise and Forecast Trends Use Data Tables and Scenarios to Project Potential Outcomes Use Goal Seek to Calculate Outcomes Forecast Data Trends Using Solver
Better Business Cases Practitioner: Virtual In-House Training
By IIL Europe Ltd
Better Business Cases™ Practitioner: Virtual In-House Training Better Business Cases™ is based on the Five Case Model - which is the UK government's best practice approach to structuring spending proposals and making effective business decisions. Using this best-practice approach will allow organizations to reduce unnecessary spending and improve the decision-making process which gives you a greater chance of securing necessary funding and support for initiatives. The goal of the practitioner course is to develop a candidate's ability to deliver a comprehensive business case, through encouraging expanded knowledge to guide the practical application of theoretical foundations. Upon the completion of this Practitioner course, a candidate will be able to start applying the model to a real business case development project. What You Will Learn At the end of this program, you will be able to: Develop the lifecycle of a business case and to establish the relationships between the five cases Apply the steps in the business case development framework, in order to support the production of a business case, using the Five Case Model, for a given scenario Overview of Better Business Cases Alignment with the strategic planning process Importance of the Business Case using the Five Case Model Overview of the Five Case Model Purpose of the key stages in the development of a spending proposal Purpose of a Business Justification Case Business Case Development Process Purpose of project / programme assurance and assurance reviews Responsibility for producing the Business Case Determining the Strategic Context and Undertaking the Strategic Assessment Scoping the Scheme and Preparing the Strategic Outline Case Planning the Scheme and Preparing the Outline Business Case Procuring the Solution and Preparing the Full Business Case Implementation and monitoring Evaluation and feedback Making the Case for Change Agree on the strategic context Determine spending objectives, existing arrangements, and business needs Determine potential business scope and key service requirements Determine benefits, risks, constraint, and dependencies Exploring the Preferred Way Forward Agree on critical success factors Determine long list options and SWOT analysis Recommend a preferred way forward Determining Potential Value for Money Revisit the short list Prepare the economic appraisal for short-listed options Undertake benefits appraisal Undertake risk appraisal Select preferred option and undertake sensitivity analysis Preparing for the Potential Deal Determine the procurement strategy Determine service streams and required outputs Outline potential risk apportionment Outline potential payment mechanisms Ascertain contractual issues and accountancy treatment Ascertaining Affordability and Funding Requirement Prepare the financial model Prepare the financial appraisals Planning for Successful Delivery Plan programme / project management Plan change and contract management Plan benefits realization Plan risk management Plan programme / project assurance and post project evaluation Procuring the Value for Money Solution Revisit the case for change Revisit the OBC options Detail procurement process and evaluation of best and final offers (BAFOs) Contracting for the Deal Set out the negotiated deal and contractual arrangements Set out the financial implications of the deal Ensuring Successful Delivery Finalize project management arrangements and plans Finalize change management arrangements and plans Finalize benefits realization arrangements and plans Finalize risk management arrangements and plans Finalize contract management arrangements and plans Finalize post-project evaluation arrangements and plans

Project Management Metrics, Key Performance Indicators, and Dashboards: On-Demand
By IIL Europe Ltd
Project Management Metrics, Key Performance Indicators, and Dashboards: On-Demand The ultimate purpose of metrics and dashboards is not to provide more information, but to provide the right information to the right person at the right time using the correct media and in a cost effective manner. This is certainly a challenge. As computer technology has grown, so has the ease by which information can be generated and presented to management and stakeholders. Today, everyone seems concerned about information overload. Unfortunately, the real issue is non-information overload. In other words, there are too many useless reports which cannot easily be read and which provide readers with too much information, much of which may have no relevance. We are now struggling to find better ways of communicating. Our focus today is on the unique needs of the receiver of the information. The need to make faster and better decisions mandates better information. Humans have a variety of ways by which they can absorb information. We must address all of these ways in the selection of the metrics and the design of the dashboards. The three most important words in a stakeholder's vocabulary are, 'Making informed decisions.' This is usually the intent of effective stakeholder relations management. Unfortunately, this cannot be accomplished without an effective information system based upon meaningful and informative metrics and key performance indicators (KPIs). For decades we believed that the only information that needed to be passed on to the client and the stakeholders were information related to time and cost. Today, we realize that true project status cannot be determined from time and cost alone. Each project may require its own unique metrics and key performance indicators. The future of project management may very well be metric-driven project management. Information design has finally come of age. Effective communications is the essence of information design. Today, we have many small companies that are specialists in information design. Larger companies may maintain their own specialist team and call these people graphic designers, information architects or interaction designers. These people maintain expertise in the visual display of both quantitative and qualitative information necessary for informed decision-making. Traditional communications and information flow has always been based upon tables, charts and indexes that were hopefully organized properly by the designer. Today, information or data graphics combines points, lines, charts, symbols, images, words, numbers, shades and a symphony of colors to convey the right message easily. What we know with certainty is that dashboards and metrics are never an end in themselves. They go through continuous improvement and are constantly updated. In a project management environment, each receiver of information can have different requirements and may request different information during the life cycle of the project. What You Will Learn Gain a better understanding of why metrics management has grown Develop a deeper understanding that there are different types of metrics and KPIs, and that not all metrics should be reported to the client or stakeholders Understand how effective metrics, when combined with dashboards, can facilitate the decision-making process Understand the complexities with dashboard design Be able to identify how many metrics are necessary and how too many metrics can create communication Understand the need for value-based metrics Understand the critical issues with the implementation of a metrics management program Understanding Value-Based Metrics Targets and Measurements Graphical Displays of Metrics and KPIs Understanding Key Performance Indicators (KPIs) Understanding Metrics The Driving Forces for Better Metrics Changing Times: The Growth of PM 2.0 Understanding Dashboards Metric Management Systems Metric Management Systems Benefits of a Metric Management Program

BOX310 SAP BusinessObjects Dashboards 4.1
By Nexus Human
Duration 3 Days 18 CPD hours This course is intended for The primary audience for this course are Application Consultants, Business Analysts, and Business Process Owners/Team Leads/Power Users. In this course, students are enabled to transform Excel workbooks into captivating dashboards for executives and business users. Introduction to Dashboards Creating Interactive Dashboards Using an Embedded Excel Workbook in the Dashboard Data Visualizations with Charts Using Data in a Range Using Data in a Series Preparing Future Data by Ignoring End Blanks Dashboard Distribution Distributing a Dashboard Single Value Components Using Single Value Components Alerts Setting Up Alerts Selectors Using Selectors Setting Default Values for Selectors Selecting Multiple Items Common Components Using Images in a Dashboard Using Tables in a Dashboard Using an Interactive Calendar in a Dashboard Adding a URL to a Dashboard Components Used as Selectors Using the Chart Component as a Selector Using the Map Component as a Selector Format Options Configuring Proportional Size and Position Using Themes to Apply Formats Using Templates to Apply Formats Applying Globalization Dynamic Visability Adding Dynamic Visibility Using Formulas to Create Dynamic Visibility Creating Multi-Layer Dashboards Dashboard Design Optimization Optimizing Dashboard Design Dashboard Connection to Live Data Using Live Data Sources Setting Up an XML Connection Using Web Services to Connect to Data Using the Query Browser to Connect to Data Using the Portal Data Connection to Connect to Data Additional course details: Nexus Humans BOX310 SAP BusinessObjects Dashboards 4.1 training program is a workshop that presents an invigorating mix of sessions, lessons, and masterclasses meticulously crafted to propel your learning expedition forward. This immersive bootcamp-style experience boasts interactive lectures, hands-on labs, and collaborative hackathons, all strategically designed to fortify fundamental concepts. Guided by seasoned coaches, each session offers priceless insights and practical skills crucial for honing your expertise. Whether you're stepping into the realm of professional skills or a seasoned professional, this comprehensive course ensures you're equipped with the knowledge and prowess necessary for success. While we feel this is the best course for the BOX310 SAP BusinessObjects Dashboards 4.1 course and one of our Top 10 we encourage you to read the course outline to make sure it is the right content for you. Additionally, private sessions, closed classes or dedicated events are available both live online and at our training centres in Dublin and London, as well as at your offices anywhere in the UK, Ireland or across EMEA.
Data Warehousing on AWS
By Nexus Human
Duration 3 Days 18 CPD hours This course is intended for This course is intended for: Database architects Database administrators Database developers Data analysts and scientists Overview This course is designed to teach you how to: Discuss the core concepts of data warehousing, and the intersection between data warehousing and big data solutions Launch an Amazon Redshift cluster and use the components, features, and functionality to implement a data warehouse in the cloud Use other AWS data and analytic services, such as Amazon DynamoDB, Amazon EMR, Amazon Kinesis, and Amazon S3, to contribute to the data warehousing solution Architect the data warehouse Identify performance issues, optimize queries, and tune the database for better performance Use Amazon Redshift Spectrum to analyze data directly from an Amazon S3 bucket Use Amazon QuickSight to perform data analysis and visualization tasks against the data warehouse Data Warehousing on AWS introduces you to concepts, strategies, and best practices for designing a cloud-based data warehousing solution using Amazon Redshift, the petabyte-scale data warehouse in AWS. This course demonstrates how to collect, store, and prepare data for the data warehouse by using other AWS services such as Amazon DynamoDB, Amazon EMR, Amazon Kinesis, and Amazon S3. Additionally, this course demonstrates how to use Amazon QuickSight to perform analysis on your data Module 1: Introduction to Data Warehousing Relational databases Data warehousing concepts The intersection of data warehousing and big data Overview of data management in AWS Hands-on lab 1: Introduction to Amazon Redshift Module 2: Introduction to Amazon Redshift Conceptual overview Real-world use cases Hands-on lab 2: Launching an Amazon Redshift cluster Module 3: Launching clusters Building the cluster Connecting to the cluster Controlling access Database security Load data Hands-on lab 3: Optimizing database schemas Module 4: Designing the database schema Schemas and data types Columnar compression Data distribution styles Data sorting methods Module 5: Identifying data sources Data sources overview Amazon S3 Amazon DynamoDB Amazon EMR Amazon Kinesis Data Firehose AWS Lambda Database Loader for Amazon Redshift Hands-on lab 4: Loading real-time data into an Amazon Redshift database Module 6: Loading data Preparing Data Loading data using COPY Data Warehousing on AWS AWS Classroom Training Concurrent write operations Troubleshooting load issues Hands-on lab 5: Loading data with the COPY command Module 7: Writing queries and tuning for performance Amazon Redshift SQL User-Defined Functions (UDFs) Factors that affect query performance The EXPLAIN command and query plans Workload Management (WLM) Hands-on lab 6: Configuring workload management Module 8: Amazon Redshift Spectrum Amazon Redshift Spectrum Configuring data for Amazon Redshift Spectrum Amazon Redshift Spectrum Queries Hands-on lab 7: Using Amazon Redshift Spectrum Module 9: Maintaining clusters Audit logging Performance monitoring Events and notifications Lab 8: Auditing and monitoring clusters Resizing clusters Backing up and restoring clusters Resource tagging and limits and constraints Hands-on lab 9: Backing up, restoring and resizing clusters Module 10: Analyzing and visualizing data Power of visualizations Building dashboards Amazon QuickSight editions and feature
[Free Modules] Power BI For Financial Data (Course 1- Beginner/Intermediate)
By Learn Data Insights Ltd
Make significant time savings by automating month-end reporting and enable users to self-serve on financial data. Reducing reliance on finance analysts to manually produce reports and analysis each month, leading to more efficient processes and faster decision-making.
![[Free Modules] Power BI For Financial Data (Course 1- Beginner/Intermediate)](https://cademy-images-io.b-cdn.net/2383f502-6f1f-4995-8674-658fcc2d7cd7/164d046c-b124-478a-9a4d-6c5c4b518915/original.png?width=3840)