- Professional Development
- Medicine & Nursing
- Arts & Crafts
- Health & Wellbeing
- Personal Development
366 Analytics courses in Mildenhall delivered Live Online
B6098 IBM Cognos Analytics - Author Active Reports (v11.0)
By Nexus Human
Duration 1 Days 6 CPD hours This course is intended for Report authors wanting to develop interactive report content, or content disconnected from IBM Cognos servers. In this course, participants increase their IBM Cognos Analytics experience by building interactive reports using Active Report controls, which can be distributed to and consumed by users in a disconnected environment, including mobile devices. Introduction to IBM Cognos Active Reports Examine IBM Cognos Active Reports Convert an existing report into an Active Report Add interactions in Active Reports using Active Report connections Create a basic Active Report Examine interactive behavior of Active Report controls Save a report in the IBM Cognos Analytics portal Save an Active Report to an MHT file Save an Active Report as a report template Use an Active Report as a prompt page Understand Active Report security Use Active Report Connections Examine Active Report connections Filter and select in controls using Active Report connections Examine variables Use a single variable to control multiple controls Use multiple variables to show different data in different controls Use Active Report controls to support mobile device usage Active Report Charts & Decks Add charts to active reports Understand and optimize chart behavior Examine decks and data decks Optimize use of decks Review Master Detail relationships Examine RAVE visualizations

Kick Start Your Career with CompTIA's Data Analysis Certification - Live Classes
(1)By Media Tek Training Solutions Ltd
Get job ready with CompTIA's Data Analysis Certification. Live Classes - Career Guidance - Exam Included.
B6259 IBM Cognos Analytics - Author Reports Advanced V11.1.x
By Nexus Human
Duration 2 Days 12 CPD hours This course is intended for Authors Overview Please refer to course overview This course teaches experienced authors advanced report building techniques to enhance, customize, manage, and distribute reports. Additionally, the student will learn how to create highly interactive and engaging reports that can be run offline by creating Active Reports. Create query models Build a query and connect it to a report Answer a business question by referencing data in a separate query Create reports based on query relationships Create join relationships between queries Combine data containers based on relationships from different queries Create a report comparing the percentage of change Introduction to dimensional reporting concepts Examine data sources and model types Describe the dimensional approach to queries Apply report authoring styles Introduction to dimensional data in reports Use members to create reports Identify sets and tuples in reports Use query calculations and set definitions Dimensional report context Examine dimensional report members Examine dimensional report measures Use the default measure to create a summarized column in a report Focus your dimensional data Focus your report by excluding members of a defined set Compare the use of the filter() function to a detail filter Filter dimensional data using slicers Calculations and dimensional functions Examine dimensional functions Show totals and exclude members Create a percent of base calculation Create advanced dynamic reports Use query macros Control report output using a query macro Create a dynamic growth report Create a report that displays summary data before detailed data and uses singletons to summarize information Design effective prompts Create a prompt that allows users to select conditional formatting values Create a prompt that provides users a choice between different filters Create a prompt to let users choose a column sort order Create a prompt to let users select a display type Examine the report specification Examine report specification flow Identify considerations when modifying report specifications Customize reporting objects Distribute reports Burst a report to email recipients by using a data item Burst a list report to the IBM Cognos Analytics portal by using a burst table Burst a crosstab report to the IBM Cognos Analytics portal by using a burst table and a master detail relationship Enhance user interaction with HTML Create interactive reports using HTML Include additional information with tooltips Send emails using links in a report Introduction to IBM Cognos Active Reports Examine Active Report controls and variables Create a simple Active Report using Static and Data-driven controls Change filtering and selection behavior in a report Create interaction between multiple controls and variables Active Report charts and decks Create an Active Report with a Deck Create an Active Report with 11.0 visualizations
B6159 IBM Cognos Analytics - Author Reports Advanced (v11.0.x)
By Nexus Human
Duration 2 Days 12 CPD hours This course is intended for Report Authors Overview Create query models Create reports based on query relationships Introduction to dimensional data Introduction to dimensional data in reports Dimensional report context Focus your dimensional data Calculations and dimensional functions Create advanced dynamic reports This offering teaches Professional Report Authors about advanced report building techniques using relational data models, dimensional data, and ways of enhancing, customizing, managing, and distributing professional reports. The course builds on topics presented in the Fundamentals course. Activities will illustrate and reinforce key concepts during this learning activity. Create query models Build a query and connect it to a report Answer a business question by referencing data in a separate query Create reports based on query relationships Create join relationships between queries Combine data containers based on relationships from different queries Create a report comparing the percentage of change Introduction to dimensional reporting concepts Examine data sources and model types Describe the dimensional approach to queries Apply report authoring styles Introduction to dimensional data in reports Use members to create reports Identify sets and tuples in reports Use query calculations and set definitions Dimensional report context Examine dimensional report members Examine dimensional report measures Use the default measure to create a summarized column in a report Focus your dimensional data Focus your report by excluding members of a defined set Compare the use of the filter() function to a detail filter Filter dimensional data using slicers Calculations and dimensional functions Examine dimensional functions Show totals and exclude members Create a percent of base calculation Create advanced dynamic reports Use query macros Control report output using a query macro Create a dynamic growth report Create a report that displays summary data before detailed data and uses singletons to summarize information Design effective prompts Create a prompt that allows users to select conditional formatting values Create a prompt that provides users a choice between different filters Create a prompt to let users choose a column sort order Create a prompt to let users select a display type Examine the report specification Examine report specification flow Identify considerations when modifying report specifications Customize reporting objects Distribute reports Burst a report to email recipients by using a data item Burst a list report to the IBM Cognos Analytics portal by using a burst table Burst a crosstab report to the IBM Cognos Analytics portal by using a burst table and a master detail relationship Enhance user interaction with HTML Create interactive reports using HTML Include additional information with tooltips Send emails using links in a report Introduction to IBM Cognos Active Reports Examine Active Report controls and variables Create a simple Active Report using Static and Data-driven controls Change filtering and selection behavior in a report Create interaction between multiple controls and variables Active Report charts and decks Create an Active Report with a Data deck Use Master detail relationships with Decks Optimize Active Reports Create an Active Report with new visualizations
Introduction to Salesforce.com Analytics - Building Reports and Dashboards
By Nexus Human
Duration 1 Days 6 CPD hours This course is intended for New administrators, business analysts or report writers who are new to creating reports or dashboards within Salesforce. Overview A student in this class will learn the basic Salesforce object model, and how to create and secure reports and dashboards. The instructor will lead students through exercises to create tabular, summary, matrix and join reports. Students will learn advanced reporting functionality such as charting, report summary fields, bucket fields, conditional highlighting, advanced report filters and building custom report types. Finally, the student will learn how to create and run dashboards and schedule and email reports and dashboards. This course is specifically designed to teach administrators, business analysts or report writers how to utilize the basic and advanced analytic capabilities of Salesforce. Introductions / Login to Training OrgsOverview of Salesforce Object ModelTabular, Summary, Matrix, Join ReportsCharts, Bucket Fields, Report Summary Fields, Conditional HighlightingCustom Report TypesDashboardsReport & Dashboard Scheduling Additional course details: Nexus Humans Introduction to Salesforce.com Analytics - Building Reports and Dashboards training program is a workshop that presents an invigorating mix of sessions, lessons, and masterclasses meticulously crafted to propel your learning expedition forward. This immersive bootcamp-style experience boasts interactive lectures, hands-on labs, and collaborative hackathons, all strategically designed to fortify fundamental concepts. Guided by seasoned coaches, each session offers priceless insights and practical skills crucial for honing your expertise. Whether you're stepping into the realm of professional skills or a seasoned professional, this comprehensive course ensures you're equipped with the knowledge and prowess necessary for success. While we feel this is the best course for the Introduction to Salesforce.com Analytics - Building Reports and Dashboards course and one of our Top 10 we encourage you to read the course outline to make sure it is the right content for you. Additionally, private sessions, closed classes or dedicated events are available both live online and at our training centres in Dublin and London, as well as at your offices anywhere in the UK, Ireland or across EMEA.
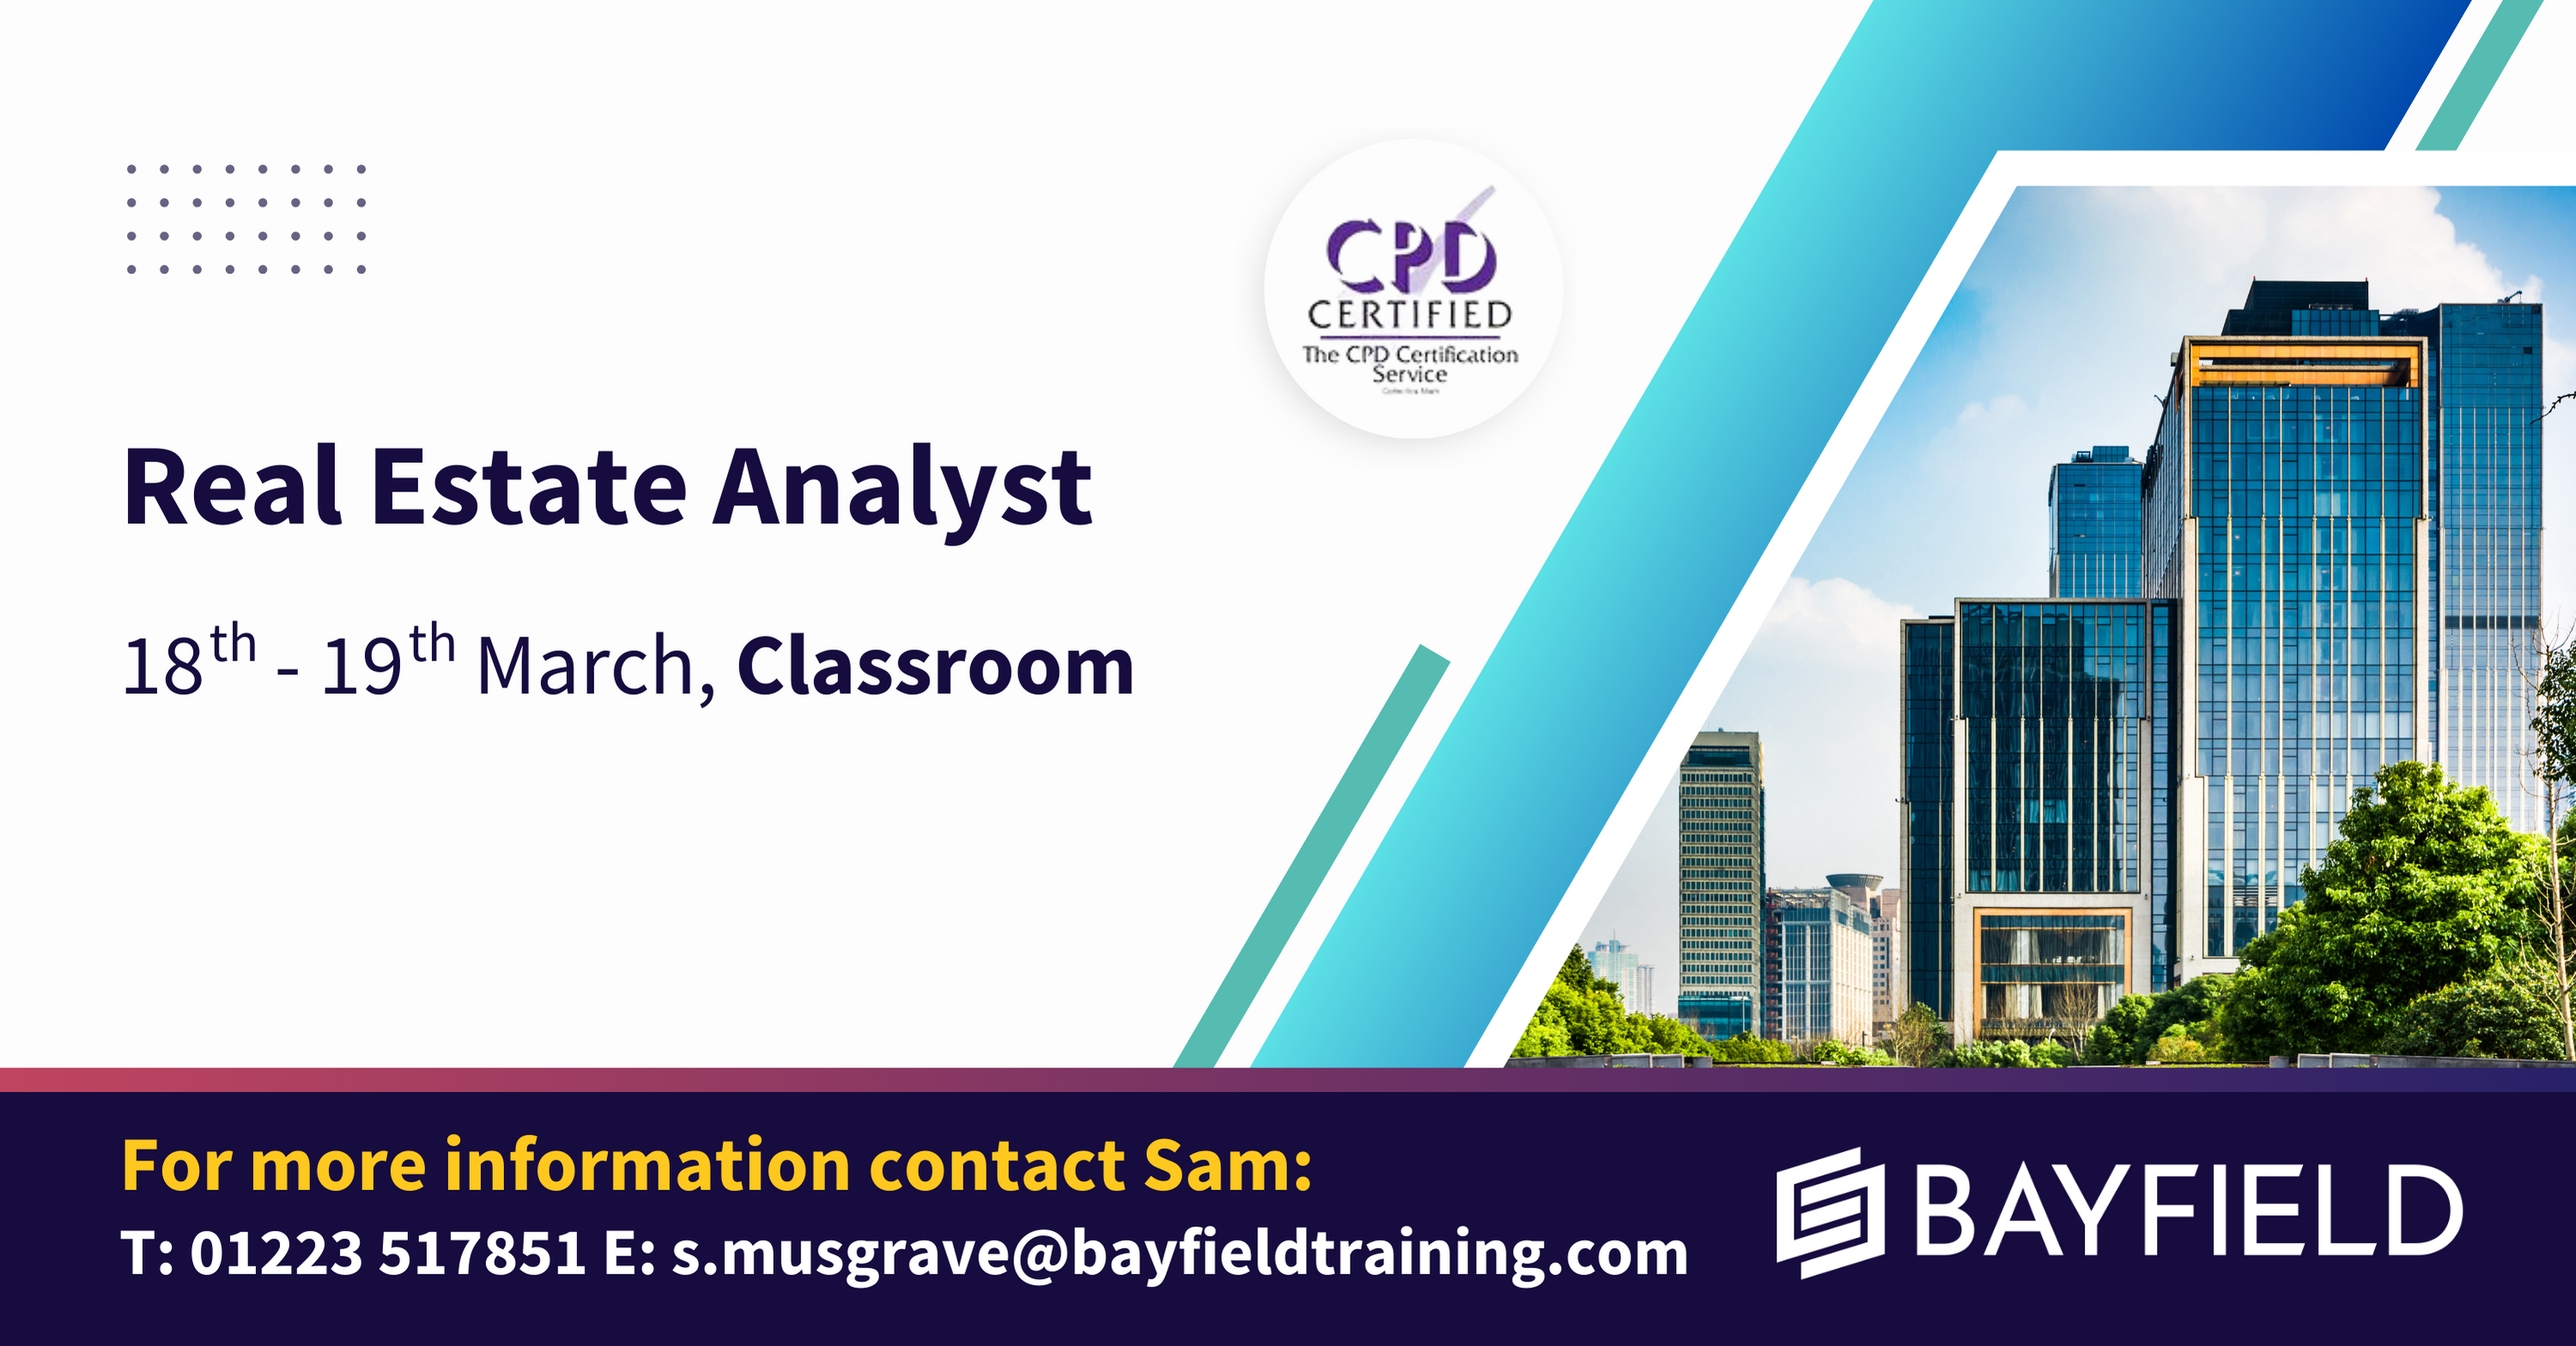
The Real Estate Analyst course has been taught non-stop to global real estate firms over the last 25 years, and is without doubt the core financial modelling training in your career portfolio. Whether you have an upcoming financial modelling test for a new job or an APC exam, the Real Estate Analyst course is the choice for you.
Visual Analytics Best Practice
By Tableau Training Uk
This course is very much a discussion, so be prepared to present and critically analyse your own and class mates work. You will also need to bring a few examples of work you have done in the past. Learning and applying best practice visualisation principles will improve effective discussions amongst decision makers throughout your organisation. As a result more end-users of your dashboards will be able to make better decisions, more quickly. This 2 Day training course is aimed at analysts with good working knowledge of BI tools (we use Tableau to present, but attendees can use their own software such as Power BI or Qlik Sense). It is a great preparation for taking advanced certifications, such as Tableau Certified Professional. Contact us to discuss the Visual Analytics Best Practice course Email us if you are interested in an on-site course, or would be interested in different dates and locations This Tableau Desktop training intermediate course is designed for the professional who has a solid foundation with Tableau and is looking to take it to the next level. Attendees should have a good understanding of the fundamental concepts of building Tableau worksheets and dashboards typically achieved from having attended our Tableau Desktop Foundation Course. At the end of this course you will be able to communicate insights more effectively, enabling your organisation to make better decisions, quickly. The Tableau Desktop Analyst training course is aimed at people who are used to working with MS Excel or other Business Intelligence tools and who have preferably been using Tableau already for basic reporting. The course includes the following topics: WHAT IS VISUAL ANALYSIS? Visual Analytics Visual Analytics Process Advantages of Visual Analysis Exercise: Interpreting Visualisations HOW DO WE PROCESS VISUAL INFORMATION? Memory and Processing Types Exercise: Identifying Types of Processing Cognitive Load Exercise: Analysing Cognitive Load Focus and Guide the Viewer Remove Visual Distractions Organise Information into Chunks Design for Proximity Exercise: Reducing Cognitive Load SENSORY MEMORY Pre-attentive Attributes Quantitatively-Perceived Attributes Categorically-Perceived Attributes Exercise: Analysing Pre-attentive Attributes Form & Attributes Exercise: Using Form Effectively Colour & Attributes Exercise: Using Colour Effectively Position & Attributes Exercise: Using Position Effectively ENSURING VISUAL INTEGRITY Informing without Misleading Gestalt Principles Visual Area Axis & Scale Colour Detail Exercise: Informing without Misleading CHOOSING THE RIGHT VISUALISATION Comparing and Ranking Categories Comparing Measures Comparing Parts to Whole Viewing Data Over Time Charts Types for Mapping Viewing Correlation Viewing Distributions Viewing Specific Values DASHBOARDS AND STORIES Exercise: Picking the Chart Type Exercise: Brainstorming Visual Best Practice Development Process for Dashboards and Stories Plan the Visualisation Create the Visualisation Test the Visualisation Exercise: Designing Dashboards and Stories This training course includes over 20 hands-on exercises to help participants “learn by doing” and to assist group discussions around real-life use cases. Each attendee receives an extensive training manual which covers the theory, practical applications and use cases, exercises and solutions together with a USB with all the materials required for the training. The course starts at 09:30 on the first day and ends at 17:00. On the second day the course starts at 09:00 and ends at 17:00. Students must bring their own laptop with an active version of Tableau Desktop 10.5 (or later) pre-installed. What People Are Saying About This Course "Steve was willing to address questions arising from his content in a full and understandable way"Lisa L. "Really enjoyed the course and feel the subject and the way it was taught was very close to my needs"James G. "The course tutor Steve was incredibly helpful and taught the information very well while making the two days very enjoyable."Bradd P. "The host and his courses will give you the tools and confidence that you need to be comfortable with Tableau."Jack S. "Steve was fantastic with his knowledge and knowhow about the product. Where possible he made sure you could put demonstrations in to working practice, to give the audience a clear understanding."Tim H. "This was a very interesting and helpful course, which will definitely help me produce smarter, cleaner visualisations that will deliver more data-driven insights within our business."Richard A. "Steve is very open to questions and will go out of his way to answer any query. Thank you"Wasif N. "Steve was willing to address questions arising from his content in a full and understandable way"Lisa L. "Really enjoyed the course and feel the subject and the way it was taught was very close to my needs"James G.

Building Data Analytics Solutions Using Amazon Redshift
By Nexus Human
Duration 1 Days 6 CPD hours This course is intended for This course is intended for data warehouse engineers, data platform engineers, and architects and operators who build and manage data analytics pipelines. Completed either AWS Technical Essentials or Architecting on AWS Completed Building Data Lakes on AWS Overview In this course, you will learn to: Compare the features and benefits of data warehouses, data lakes, and modern data architectures Design and implement a data warehouse analytics solution Identify and apply appropriate techniques, including compression, to optimize data storage Select and deploy appropriate options to ingest, transform, and store data Choose the appropriate instance and node types, clusters, auto scaling, and network topology for a particular business use case Understand how data storage and processing affect the analysis and visualization mechanisms needed to gain actionable business insights Secure data at rest and in transit Monitor analytics workloads to identify and remediate problems Apply cost management best practices In this course, you will build a data analytics solution using Amazon Redshift, a cloud data warehouse service. The course focuses on the data collection, ingestion, cataloging, storage, and processing components of the analytics pipeline. You will learn to integrate Amazon Redshift with a data lake to support both analytics and machine learning workloads. You will also learn to apply security, performance, and cost management best practices to the operation of Amazon Redshift. Module A: Overview of Data Analytics and the Data Pipeline Data analytics use cases Using the data pipeline for analytics Module 1: Using Amazon Redshift in the Data Analytics Pipeline Why Amazon Redshift for data warehousing? Overview of Amazon Redshift Module 2: Introduction to Amazon Redshift Amazon Redshift architecture Interactive Demo 1: Touring the Amazon Redshift console Amazon Redshift features Practice Lab 1: Load and query data in an Amazon Redshift cluster Module 3: Ingestion and Storage Ingestion Interactive Demo 2: Connecting your Amazon Redshift cluster using a Jupyter notebook with Data API Data distribution and storage Interactive Demo 3: Analyzing semi-structured data using the SUPER data type Querying data in Amazon Redshift Practice Lab 2: Data analytics using Amazon Redshift Spectrum Module 4: Processing and Optimizing Data Data transformation Advanced querying Practice Lab 3: Data transformation and querying in Amazon Redshift Resource management Interactive Demo 4: Applying mixed workload management on Amazon Redshift Automation and optimization Interactive demo 5: Amazon Redshift cluster resizing from the dc2.large to ra3.xlplus cluster Module 5: Security and Monitoring of Amazon Redshift Clusters Securing the Amazon Redshift cluster Monitoring and troubleshooting Amazon Redshift clusters Module 6: Designing Data Warehouse Analytics Solutions Data warehouse use case review Activity: Designing a data warehouse analytics workflow Module B: Developing Modern Data Architectures on AWS Modern data architectures
Hands-on Predicitive Analytics with Python (TTPS4879)
By Nexus Human
Duration 3 Days 18 CPD hours This course is intended for This course is geared for Python experienced attendees who wish to learn and use basic machine learning algorithms and concepts. Students should have skills at least equivalent to the Python for Data Science courses we offer. Overview Working in a hands-on learning environment, guided by our expert team, attendees will learn to Understand the main concepts and principles of predictive analytics Use the Python data analytics ecosystem to implement end-to-end predictive analytics projects Explore advanced predictive modeling algorithms w with an emphasis on theory with intuitive explanations Learn to deploy a predictive model's results as an interactive application Learn about the stages involved in producing complete predictive analytics solutions Understand how to define a problem, propose a solution, and prepare a dataset Use visualizations to explore relationships and gain insights into the dataset Learn to build regression and classification models using scikit-learn Use Keras to build powerful neural network models that produce accurate predictions Learn to serve a model's predictions as a web application Predictive analytics is an applied field that employs a variety of quantitative methods using data to make predictions. It involves much more than just throwing data onto a computer to build a model. This course provides practical coverage to help you understand the most important concepts of predictive analytics. Using practical, step-by-step examples, we build predictive analytics solutions while using cutting-edge Python tools and packages. Hands-on Predictive Analytics with Python is a three-day, hands-on course that guides students through a step-by-step approach to defining problems and identifying relevant data. Students will learn how to perform data preparation, explore and visualize relationships, as well as build models, tune, evaluate, and deploy models. Each stage has relevant practical examples and efficient Python code. You will work with models such as KNN, Random Forests, and neural networks using the most important libraries in Python's data science stack: NumPy, Pandas, Matplotlib, Seabor, Keras, Dash, and so on. In addition to hands-on code examples, you will find intuitive explanations of the inner workings of the main techniques and algorithms used in predictive analytics. The Predictive Analytics Process Technical requirements What is predictive analytics? Reviewing important concepts of predictive analytics The predictive analytics process A quick tour of Python's data science stack Problem Understanding and Data Preparation Technical requirements Understanding the business problem and proposing a solution Practical project ? diamond prices Practical project ? credit card default Dataset Understanding ? Exploratory Data Analysis Technical requirements What is EDA? Univariate EDA Bivariate EDA Introduction to graphical multivariate EDA Predicting Numerical Values with Machine Learning Technical requirements Introduction to ML Practical considerations before modeling MLR Lasso regression KNN Training versus testing error Predicting Categories with Machine Learning Technical requirements Classification tasks Credit card default dataset Logistic regression Classification trees Random forests Training versus testing error Multiclass classification Naive Bayes classifiers Introducing Neural Nets for Predictive Analytics Technical requirements Introducing neural network models Introducing TensorFlow and Keras Regressing with neural networks Classification with neural networks The dark art of training neural networks Model Evaluation Technical requirements Evaluation of regression models Evaluation for classification models The k-fold cross-validation Model Tuning and Improving Performance Technical requirements Hyperparameter tuning Improving performance Implementing a Model with Dash Technical requirements Model communication and/or deployment phase Introducing Dash Implementing a predictive model as a web application Additional course details: Nexus Humans Hands-on Predicitive Analytics with Python (TTPS4879) training program is a workshop that presents an invigorating mix of sessions, lessons, and masterclasses meticulously crafted to propel your learning expedition forward. This immersive bootcamp-style experience boasts interactive lectures, hands-on labs, and collaborative hackathons, all strategically designed to fortify fundamental concepts. Guided by seasoned coaches, each session offers priceless insights and practical skills crucial for honing your expertise. Whether you're stepping into the realm of professional skills or a seasoned professional, this comprehensive course ensures you're equipped with the knowledge and prowess necessary for success. While we feel this is the best course for the Hands-on Predicitive Analytics with Python (TTPS4879) course and one of our Top 10 we encourage you to read the course outline to make sure it is the right content for you. Additionally, private sessions, closed classes or dedicated events are available both live online and at our training centres in Dublin and London, as well as at your offices anywhere in the UK, Ireland or across EMEA.
DP-203T00 Data Engineering on Microsoft Azure
By Nexus Human
Duration 4 Days 24 CPD hours This course is intended for The primary audience for this course is data professionals, data architects, and business intelligence professionals who want to learn about data engineering and building analytical solutions using data platform technologies that exist on Microsoft Azure. The secondary audience for this course includes data analysts and data scientists who work with analytical solutions built on Microsoft Azure. In this course, the student will learn how to implement and manage data engineering workloads on Microsoft Azure, using Azure services such as Azure Synapse Analytics, Azure Data Lake Storage Gen2, Azure Stream Analytics, Azure Databricks, and others. The course focuses on common data engineering tasks such as orchestrating data transfer and transformation pipelines, working with data files in a data lake, creating and loading relational data warehouses, capturing and aggregating streams of real-time data, and tracking data assets and lineage. Prerequisites Successful students start this course with knowledge of cloud computing and core data concepts and professional experience with data solutions. AZ-900T00 Microsoft Azure Fundamentals DP-900T00 Microsoft Azure Data Fundamentals 1 - Introduction to data engineering on Azure What is data engineering Important data engineering concepts Data engineering in Microsoft Azure 2 - Introduction to Azure Data Lake Storage Gen2 Understand Azure Data Lake Storage Gen2 Enable Azure Data Lake Storage Gen2 in Azure Storage Compare Azure Data Lake Store to Azure Blob storage Understand the stages for processing big data Use Azure Data Lake Storage Gen2 in data analytics workloads 3 - Introduction to Azure Synapse Analytics What is Azure Synapse Analytics How Azure Synapse Analytics works When to use Azure Synapse Analytics 4 - Use Azure Synapse serverless SQL pool to query files in a data lake Understand Azure Synapse serverless SQL pool capabilities and use cases Query files using a serverless SQL pool Create external database objects 5 - Use Azure Synapse serverless SQL pools to transform data in a data lake Transform data files with the CREATE EXTERNAL TABLE AS SELECT statement Encapsulate data transformations in a stored procedure Include a data transformation stored procedure in a pipeline 6 - Create a lake database in Azure Synapse Analytics Understand lake database concepts Explore database templates Create a lake database Use a lake database 7 - Analyze data with Apache Spark in Azure Synapse Analytics Get to know Apache Spark Use Spark in Azure Synapse Analytics Analyze data with Spark Visualize data with Spark 8 - Transform data with Spark in Azure Synapse Analytics Modify and save dataframes Partition data files Transform data with SQL 9 - Use Delta Lake in Azure Synapse Analytics Understand Delta Lake Create Delta Lake tables Create catalog tables Use Delta Lake with streaming data Use Delta Lake in a SQL pool 10 - Analyze data in a relational data warehouse Design a data warehouse schema Create data warehouse tables Load data warehouse tables Query a data warehouse 11 - Load data into a relational data warehouse Load staging tables Load dimension tables Load time dimension tables Load slowly changing dimensions Load fact tables Perform post load optimization 12 - Build a data pipeline in Azure Synapse Analytics Understand pipelines in Azure Synapse Analytics Create a pipeline in Azure Synapse Studio Define data flows Run a pipeline 13 - Use Spark Notebooks in an Azure Synapse Pipeline Understand Synapse Notebooks and Pipelines Use a Synapse notebook activity in a pipeline Use parameters in a notebook 14 - Plan hybrid transactional and analytical processing using Azure Synapse Analytics Understand hybrid transactional and analytical processing patterns Describe Azure Synapse Link 15 - Implement Azure Synapse Link with Azure Cosmos DB Enable Cosmos DB account to use Azure Synapse Link Create an analytical store enabled container Create a linked service for Cosmos DB Query Cosmos DB data with Spark Query Cosmos DB with Synapse SQL 16 - Implement Azure Synapse Link for SQL What is Azure Synapse Link for SQL? Configure Azure Synapse Link for Azure SQL Database Configure Azure Synapse Link for SQL Server 2022 17 - Get started with Azure Stream Analytics Understand data streams Understand event processing Understand window functions 18 - Ingest streaming data using Azure Stream Analytics and Azure Synapse Analytics Stream ingestion scenarios Configure inputs and outputs Define a query to select, filter, and aggregate data Run a job to ingest data 19 - Visualize real-time data with Azure Stream Analytics and Power BI Use a Power BI output in Azure Stream Analytics Create a query for real-time visualization Create real-time data visualizations in Power BI 20 - Introduction to Microsoft Purview What is Microsoft Purview? How Microsoft Purview works When to use Microsoft Purview 21 - Integrate Microsoft Purview and Azure Synapse Analytics Catalog Azure Synapse Analytics data assets in Microsoft Purview Connect Microsoft Purview to an Azure Synapse Analytics workspace Search a Purview catalog in Synapse Studio Track data lineage in pipelines 22 - Explore Azure Databricks Get started with Azure Databricks Identify Azure Databricks workloads Understand key concepts 23 - Use Apache Spark in Azure Databricks Get to know Spark Create a Spark cluster Use Spark in notebooks Use Spark to work with data files Visualize data 24 - Run Azure Databricks Notebooks with Azure Data Factory Understand Azure Databricks notebooks and pipelines Create a linked service for Azure Databricks Use a Notebook activity in a pipeline Use parameters in a notebook Additional course details: Nexus Humans DP-203T00 Data Engineering on Microsoft Azure training program is a workshop that presents an invigorating mix of sessions, lessons, and masterclasses meticulously crafted to propel your learning expedition forward. This immersive bootcamp-style experience boasts interactive lectures, hands-on labs, and collaborative hackathons, all strategically designed to fortify fundamental concepts. Guided by seasoned coaches, each session offers priceless insights and practical skills crucial for honing your expertise. Whether you're stepping into the realm of professional skills or a seasoned professional, this comprehensive course ensures you're equipped with the knowledge and prowess necessary for success. While we feel this is the best course for the DP-203T00 Data Engineering on Microsoft Azure course and one of our Top 10 we encourage you to read the course outline to make sure it is the right content for you. Additionally, private sessions, closed classes or dedicated events are available both live online and at our training centres in Dublin and London, as well as at your offices anywhere in the UK, Ireland or across EMEA.