- Professional Development
- Medicine & Nursing
- Arts & Crafts
- Health & Wellbeing
- Personal Development
366 Analytics courses in London delivered Live Online
Tableau Desktop Training - Analyst
By Tableau Training Uk
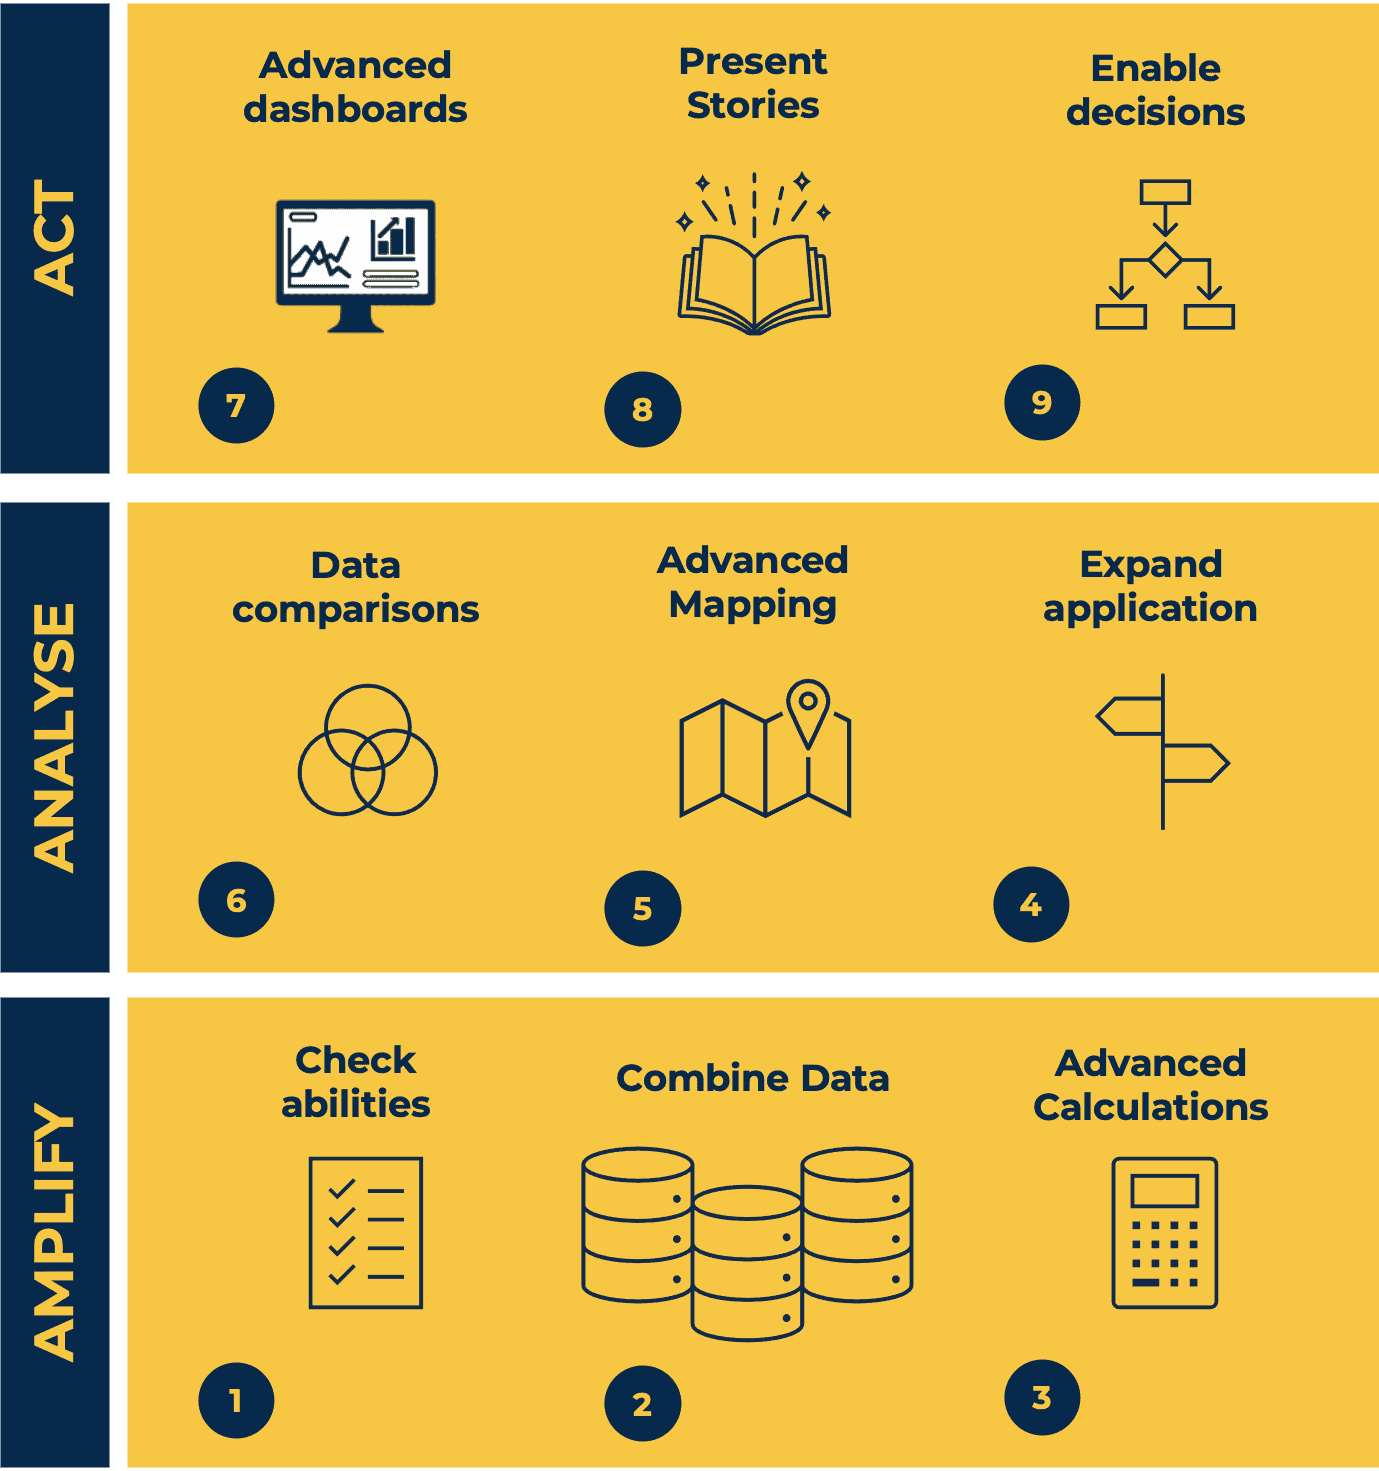
This Tableau Desktop Training intermediate course is designed for the professional who has a solid foundation with Tableau and is looking to take it to the next level. For Private options, online or in-person, please send us details of your requirements: This Tableau Desktop training intermediate course is designed for the professional who has a solid foundation with Tableau and is looking to take it to the next level. Attendees should have a good understanding of the fundamental concepts of building Tableau worksheets and dashboards typically achieved from having attended our Tableau Desktop Foundation Course. At the end of this course you will be able to communicate insights more effectively, enabling your organisation to make better decisions, quickly. The Tableau Desktop Analyst training course is aimed at people who are used to working with MS Excel or other Business Intelligence tools and who have preferably been using Tableau already for basic reporting. The course is split into 3 phases and 9 modules: Phase 1: AMPLIFY MODULE 1: CHECK ABILITIES Revision – What I Should Know What is possibleHow does Tableau deal with dataKnow your way aroundHow do we format chartsHow Tableau deals with datesCharts that compare multiple measuresCreating Tables MODULE 2: COMBINE DATA Relationships Joining Tables – Join Types, Joining tables within the same database, cross database joins, join calculations Blending – How to create a blend with common fields, Custom defined Field relationships and mismatched element names, Calculated fields in blended data sources Unions – Manual Unions and mismatched columns, Wildcard unions Data Extracts – Creating & Editing Data extracts MODULE 3: ADVANCED CALCULATIONS Row Level v Aggregations Aggregating dimensions in calculations Changing the Level of Detail (LOD) of calculations – What, Why, How Adding Table Calculations Phase 2: ANALYSE MODULE 4: EXPAND APPLICATION Making things dynamic with parameters Sets Trend Lines How do we format charts Forecasting MODULE 5: ADVANCED MAPPING Using your own images for spatial analysis Mapping with Spatial files MODULE 6: DATA COMPARISONS Advanced Charts Bar in Bar charts Bullet graphs Creating Bins and Histograms Creating a Box & Whisker plot Phase 3: ACT MODULE 7: ADVANCED DASHBOARDS Using the dashboard interface and Device layout Dashboard Actions and Viz In tooltips Horizontal & Vertical containers Navigate between dashboards MODULE 8: PRESENT STORIES Telling data driven stories MODULE 9: ENABLE DECISIONS What is Tableau Server Publishing & Permissions How can your users engage with content This training course includes over 25 hands-on exercises and quizzes to help participants “learn by doing” and to assist group discussions around real-life use cases. Each attendee receives a login to our extensive training portal which covers the theory, practical applications and use cases, exercises, solutions and quizzes in both written and video format. Students must bring their own laptop with an active version of Tableau Desktop 2018.2 (or later) pre-installed. What People Are Saying About This Course “Course was fantastic, and completely relevant to the work I am doing with Tableau. I particularly liked Steve’s method of teaching and how he applied the course material to ‘real-life’ use-cases.”Richard W., Dashboard Consulting Ltd “This course was extremely useful and excellent value. It helped me formalise my learning and I have taken a lot of useful tips away which will help me in everyday work.” Lauren M., Baillie Gifford “I would definitely recommend taking this course if you have a working knowledge of Tableau. Even the little tips Steve explains will make using Tableau a lot easier. Looking forward to putting what I’ve learned into practice.”Aron F., Grove & Dean “Steve is an excellent teacher and has a vast knowledge of Tableau. I learned a huge amount over the two days that I can immediately apply at work.”John B., Mporium “Steve not only provided a comprehensive explanation of the content of the course, but also allowed time for discussing particular business issues that participants may be facing. That was really useful as part of my learning process.”Juan C., Financial Conduct Authority “Course was fantastic, and completely relevant to the work I am doing with Tableau. I particularly liked Steve’s method of teaching and how he applied the course material to ‘real-life’ use-cases.”Richard W., Dashboard Consulting Ltd “This course was extremely useful and excellent value. It helped me formalise my learning and I have taken a lot of useful tips away which will help me in everyday work.” Lauren M., Baillie Gifford “I would definitely recommend taking this course if you have a working knowledge of Tableau. Even the little tips Steve explains will make using Tableau a lot easier. Looking forward to putting what I’ve learned into practice.”Aron F., Grove & Dean “Steve is an excellent teacher and has a vast knowledge of Tableau. I learned a huge amount over the two days that I can immediately apply at work.”John B., Mporium
Fraud (In-House)
By The In House Training Company
Fraud should not happen, but it does. It can happen at the highest to lowest levels in an organisation. Recent surveys show that incidents of fraud are not decreasing. Fraud costs companies money and, perhaps even more importantly, reputational damage. The losers are not just the shareholders, suppliers, customers, etc, but society as a whole. This programme shows why frauds happen, how organisations put themselves at risk and what they can do to prevent it. This programme will help directors and others understand: The motives for committing fraud Directors' responsibilities for identifying and reporting fraud What types of frauds there are How frauds are perpetrated How they can be prevented How regulators deal with fraud Above all, the principal objective of this programme is to help make your organisation as secure as possible from the threat of fraud. 1 Motives for committing fraud - drivers of fraud Session objective: to understand why people might commit fraud Drivers of fraudulent behaviourAmbitionGreedTheftConceit? And more! 2 Accounting mechanisms that allow fraud Session objective: to review the elements of the accounting, internal control and management processes that allow creative accounting Income or liability? Asset or expense? Coding errors and misclassification Netting off and grossing up Off-balance sheet items 3 Structures that allow fraud Session objective: to consider company and trading structures that allow frauds to be perpetrated Group structures Trading structures Tax havens Importing and exporting 4 Interpretations and other non-compliance that allow fraud Session objective: to look at how creative interpretations of law and accounting practice may permit fraud The place of accounting standards Accounting policies Trading methods The place of auditing standards 5 Money laundering Session objective: to review what constitutes money laundering Types of money laundering Identifying laundering Preventing laundering 6 Preventing fraud - proper management structures Session objective: to review the place of proper corporate governance Corporate governance Company management structure Audit committees The place of internal audit 7 Preventing fraud - proper accounting Session objective: to review best accounting and auditing practice Accounting standards Internal accounting policies Adequacy of internal controls Internal audit 8 Preventing fraud - regulation Session objective: to look at how regulators aim to prevent fraud The regulatory environment Financial services regulation 9 Conclusion Course review Open forum Close 10 Course summary - developing your own cost action plan Group and individual action plans will be prepared with a view to participants identifying their cost risks areas and the techniques which can be immediately applied to improve costing and reduce costs

Commercial instinct (In-House)
By The In House Training Company
An insightful, enjoyable and experiential programme to help you analyse data and information and make a balanced decision based upon sound commercial reasoning. It will enable you to identify options, make decisions and take actions based on a thorough analysis combined with instinct and intuition to make a positive effect on profitability. This programme will help you: Identify ways to analyse data and sort relevant from irrelevant information Develop analytical and numerate thinking, and consider the financial implications of a decision Make decisions based on sound commercial reasoning - a mix of intuition and analysis Select from a range of tools to analyse a situation and apply these effectively Understand how costs and profits are calculated Use tried-and-tested techniques to manage and control your budgets Appreciate the fundamentals of financial analysis Focus on the bottom line Identify the basics of capital investment appraisal for your business Evaluate results and seek opportunities for improvement to your business 1 The commercial environment What do shareholders and investors want? What do managers want? Profit v non-profit organisations Investor expectations 2 Financial and non-financial information Risk and reward considerations Drivers of commercial decisions 3 Running a business A practical exercise to bring financial statements to life Different stakeholder interests in a business The impact and consequences of decisions on financial statements 4 Where do I make a difference to the organisation? How can I contribute to an improved business performance? Key performance indicators - measuring the right things A 'balanced scorecard' approach - it's not all about money! 5 A 'balanced scorecard' approach Analysing and reviewing my contribution to the business direction What is the current focus of my commercial decisions? Developing the business in the right way - getting the balance right! Where should/could it be in the future? Do my decisions support the overall vision and strategy? 6 Making commercial decisions Left-brain and right-brain thinking Convergent and divergent thinking Analysis and instinct Interactive case study exercise - emotional and rational decisions Reflection - what is my style of making decisions 7 Let's consider the customer! Identifying target markets Differentiating propositions and products Customer service considerations Marketing considerations and initiatives Pricing strategies and considerations 8 Strategic analysis The external environment The internal environment LEPEST analysis SWOT analysis Forecasting Group activity - analysing markets and the competition How do these improve your decisions? 9 Comparing performance Analysing key financial ratios Ways to compare performance and results Break-even analysis 10 Profit and loss accounts and budgeting Managing income and expenditure The budgeting process How does this link to the profit and loss account? Managing and controlling a cost centre/budget The role of the finance department Different ways of budgeting Incremental budgeting Zero-based budgeting 11 Understanding the balance sheet Purpose of balance sheets Understanding and navigating the content What does a balance sheet tell you? How do you affect your balance sheet? Links to the profit and loss account A practical team exercise that brings financial statements to life 12 Business decisions exercise How does this improve your decisions? A practical exercise to apply new knowledge and bring commercial thinking to to life The impact and consequences of decisions on financial statements 13 Working capital Why is this important? The importance of keeping cash flowing Business decisions that affect cash Calculating profit 14 Capital investment appraisal Capex v Opex Payback Return on investment The future value of money The concept of hurdle rate 15 Lessons learned and action planning So what? Recap and consolidation of learning The decisions that I need to consider Actions to achieve my plan
Cost reduction (In-House)
By The In House Training Company
Businesses that don't control their costs don't stay in business. How well are you doing? Is everyone in your organisation sufficiently aware of costs, managing them effectively and maximising opportunities to reduce them? If there is scope for improvement, this course will help get you back on track. It will demonstrate that cost reduction is so much more than cost control and cost cutting. True cost management is about being aware of costs, seeking to reduce them through good design and efficient operating practices whilst taking continuing action on overspending. This course will develop the participants' skills in: Being aware of costs at all times Seeking cost reduction from the start (including life-cycle costing) Appraising projects / production to identify and take out risk Understanding real budgeting Using techniques such as ZBB and ABC where appropriate Ensuring cost reports lead to action Managing a cost reduction process that delivers Benefits to the organisation will include: Identification of cost reduction and business improvement opportunities Better reporting and ownership of costs Greater awareness and control of everyday costs 1 Introduction - the cost management process The risks of poor cost control Capital and revenue costs The importance of cost awareness The importance of cost reduction Cost management - the key aspects How to build a cost management and control process checklist for your areas of responsibility 2 Cost removal - taking out costs Cost awareness Costs of poor design / poor processes Value engineering Removing redundant costs 3 The need for commercial, technical and financial appraisals Understand the problems before cash is committed and costs incurred Making the effort to identify commercial and technical risk The time value of money - DCF techniques for long term projects Cost models for production processes and projects Costing models - project appraisals The use of spreadsheets to identify sensitivity and risk How to focus on risk management 4 Budgeting - proper budgeting challenges costs The philosophy of the business - are costs an issue? The importance of having the right culture The need for detailed business objectives Budgetary control measures Designing budget reports - for action 5 Zero-based budgeting (ZBB) - the principles Much more than starting with a clean sheet of paper What ZBB can achieve The concept of decision packages - to challenge business methods and costs Only necessary costs should be incurred A review of an operating budget - demonstrating what ZBB challenges and the costs it may lead to being taken out 6 Awareness of overheads and other costs Definitions of cost - direct and indirect Dealing with overheads - what is meant by allocation, absorption or apportionment? The apparent and real problems with overheads Different ways of dealing with overheads Review of overhead allocation methods and accounting and reporting issues 7 Overheads and product costing Activity-based costing (ABC) - the principles Where and how the ABC approach may be helpful Know the 'true' cost of a product or a project Should you be in business? Will you stay in business? Identifying weaknesses in a traditional overhead allocation How ABC will help improve product or service costing Identifying which products and activities should be developed and which abandoned 8 Cost reduction culture The need for cost reports What measures can be used to identify over-spends as early as possible Cost control performance measures and ratios 9 Design of cost control reports Reports should lead to action and deliver Selecting cost control measures which can be acted upon Practice in designing action reports 10 Course summary - developing your own cost action plan Group and individual action plans will be prepared with a view to participants identifying their cost risks areas and the techniques which can be immediately applied to improve costing and reduce costs
BA20 - Business Process Improvement
By Nexus Human
Duration 2 Days 12 CPD hours This course is intended for It is appropriate for Managers, Executives, Project Managers, Business Analysts, Business and IT stakeholders working with analysts, Quality and process engineers, technicians, managers; supervisors, team leaders, and process operators. Overview Describe business process improvement (BPI) business drivers.Plan, manage and close requirements for a Business Process Improvement project Understand the essential elements of a successful BPI initiative.Identify candidate business processes for improvement.Understand the essential elements of a successful BPI initiative.Identify candidate business processes for improvement.Apply a methodology to business process improvement projects. This 2-day course aims at introducing its attendees to the core values, principles, and practices of Business Process Improvement. Introduction - A Business Process Improvement (BPI) Overview Why are we here today? What is BPI? Benefits of BPI Specific challenges/obstacles and successes Process improvement examples: Industry specific examples Famous debacles to avoid and successes to emulate Your role in helping to identify problems Overview of the Joiner 7-Step Method What is the Joiner 7-Step Method? Walkthrough of the Joiner 7-Step Method Template: Introduce and review Process Improvement Template Case Study Exercise: Read and discuss introduction to the Case Study Step #1: Initiate the Project Types of business problems typically encountered at insurance companies and banks How to recognize a business-related problem Identifying the gaps (delta between current and future states) Ownership of the project and the business problem Defining measurable success criteria Case Study Exercise: Complete the Problem Statement section (Step #1) of the template Step #2: Define Current Situation What are symptoms of a problem? Looking for symptoms of the problem Performing Stakeholder Analysis Technique: View a RACI Matrix Defining the impacts caused by the problem Technique: Business Process Modeling (As-Is) Understand how to draw an As-Is Business Process Model Case Study Exercise: Complete the Define Current Situation section (Step #2) of the template Step #3: Identify Root Causes What are root causes? Performing Root Cause Analysis Technique: Fishbone Diagram using the cafeteria example Case Study Exercise: Discuss a Fishbone Diagram Technique: Pareto Chart (discuss and show example) Case Study Exercise: Complete the Identify Root Causes section (Step #3) of the template Step #4: Develop Solutions Identifying options for problem resolution Avoid jumping to conclusions Technique: Brainstorming Case Study Exercise: Conduct a Brainstorming Session Recognizing pros and cons for each option Technique: Kempner-Tregoe (?Must-Have? vs. ?Nice-to-Have?) Case Study Exercise: Determine best solution using a ?simple? Kempner-Tregoe model Case Study Exercise: Complete the Develop Solutions section (Step #4) of the template Step #5: Define Measurable Results Prototyping the solution Technique: Business Process Modeling (To-Be) Measuring results against the success criteria (Step #1) Case Study Exercise: Review changes to an As-Is Business Process Model Case Study Exercise: Complete the Define Measurable Results section (Step #5) of the template Step #6: Standardize Process Defining how the process will be documented Plan and understand organizational readiness Discuss how employees are empowered to identify and act upon their ideas Identifying follow-up needs (i.e., training) for the staff that will be impacted Technique: Communication Plan Case Study Exercise: Complete the Standardize Process section (Step #6) of the template Step #7: Determine Future Plans Monitoring the process for Continuous Process Improvement (The ?Plan-Do-Check-Act? Cycle) Understand how to sustain the improvements made by the Joiner 7-Step Method Technique: PDCA form Case Study Exercise: Complete the Determine Future Plans section (Step #7) of the template Going Forward with a Plan of Action Identifying process problems in your organization Individual Exercise: Name three (3) possible areas for improvement Prioritize and define the next steps Individual Exercise: Using a new template complete Step 2 & Step 3 for one possible area for improvement you have identified

Microsoft Power BI Online
By Nexus Human
Duration 1 Days 6 CPD hours This course is intended for The student should be familiar with Excel and the concepts of datasets and basic reporting. Overview Understand and utilize Power BI Online. Understand and examine the differences between Power BI Desktop and Power BI Online. Understand and explore the Power BI Online interface. Understand and perform importing Excel worksheets, CSV, TXT, PBIX. Understand connecting to databases. Understand other forms of data. Understand data refresh. Understand and perform creating a new Power BI report. Understand and perform adding filters to a report. Understand and perform adding KPI's to a report. Understand and perform creating a Power BI dashboard. Understand and perform pinning tiles. Understand sharing reports and dashboards. Understand Power BI Mobile. This Logical Operations courseware is no longer available on the LO Store, but can be purchased by phone orderThis one-day course familiarizes the student with Power BI Online, which allows the student to intuitively discover and automate the import, transformation, and combination of data across a variety of data sources. COURSE OVERVIEW Introduction Course Materials Facilities Prerequisites What We'll Be Discussing INTRODUCTION TO POWER BI ONLINE What is Power BI Online Examining the Differences Between Power BI Desktop and Power BI Online Exploring the Power BI Online Interface IMPORTING DATA Utilizing Excel (.xlsx or .xlsm), Comma Separated Value (.csv), and Power BI Desktop (.pbix) Files Connecting to Databases Examining Other Forms of Data Understanding Data Refresh CREATING REPORTS Creating a New Power BI Report Adding Filters to a Power BI Report Adding KPI?s to a Report CONFIGURING DASHBOARDS Creating a Power BI Dashboard Pinning Tiles SHARING REPORTS AND DASHBOARDS Sharing Reports and Dashboards Exploring Power BI Mobile
6F87G IBM Sterling B2B Integrator Fundamentals
By Nexus Human
Duration 5 Days 30 CPD hours This course is intended for This course is designed for EDI End Users, Connect: End Users, Web Developers, as well as System Administrators. Overview After completing this course, students should be able to: Run a business process. Create a business process using the Graphical Process Modeler. Explain how to create a service configuration. Explain how to track an executable business process. Discuss the basics of Sterling B2B Integrator. This course provides students with a detailed examination of Sterling B2B Integrator, which provides end-to-end enterprise integration server for dynamic real-time and near-real time business collaboration and commerce automation.This course teaches students techniques, tools and recommended practices that can be used to run a business process, create a business process using the Graphical Process Modeler, explain how to create a service configuration, explain how to track an executable business process, and discuss the basics of Sterling B2B Integrator through a combination of lecture and hands-on labs. About IBM Sterling B2B Integrator Exercise. About Sterling B2B Integrator Basic BPML Concepts Exercise. Basic BPML Concepts XPath Basics Exercise. XPath Basics Graphical Process Modeler (GPM) Exercise. Graphical Process Modeler (GPM) Using the GPM Exercise. Using the GPM Troubleshooting a Business Process Exercise. Troubleshooting a Business Process Introduction to Service Management Exercise. Introduction to Service Management Case Study Sterling B2B Integrator Mapping Exercise. Sterling B2B Integrator Mapping Typing Map Exercise. Typing Map Tracking System Health Exercise. Tracking System Health Best Practices Exercise. Best Practices Case Study Course Wrap Up
Power BI - dashboards (1 day) (In-House)
By The In House Training Company
Power BI is a powerful data visualisation program that allows businesses to monitor data, analyse trends, and make decisions. This course is designed to provide a solid understanding of the reporting side of Power BI, the dashboards, where administrators, and end users can interact with dynamic visuals that communicates information. This course focuses entirely on the creation and design of visualisations in dashboards, including a range of chart types, engaging maps, and different types of tables. Designing dashboards with KPI's (key performance indicators), heatmaps, flowcharts, sparklines, and compare multiple variables with trendlines. This one-day programme focuses entirely on creating dashboards, by using the many visualisation tools available in Power BI. You will learn to build dynamic, user-friendly interfaces in both Power BI Desktop and Power BI Service. 1 Introduction Power BI ecosystem Things to keep in mind Selecting dashboard colours Importing visuals into Power BI Data sources for your analysis Joining tables in Power BI 2 Working with data Utilising a report theme Table visuals Matrix visuals Drilling into hierarchies Applying static filters Group numbers with lists Group numbers with bins 3 Creating visuals Heatmaps in Power BI Visualising time-intelligence trends Ranking categorical totals Comparing proportions View trends with sparklines 4 Comparing variables Insert key performance indicators (KPI) Visualising trendlines as KPI Forecasting with trendlines Visualising flows with Sankey diagrams Creating a scatter plot 5 Mapping options Map visuals Using a filled map Mapping with latitude and longitude Mapping with ArcGIS or ESRI 6 Creating dashboards High-level dashboard Migration analysis dashboard Adding slicers for filtering Promote interaction with nudge prompts Searching the dashboard with a slicer Creating dynamic labels Highlighting key points on the dashboard Customised visualisation tooltips Syncing slicers across pages 7 Sharing dashboards Setting up and formatting phone views Exporting data Creating PDF files Uploading to the cloud Share dashboards in SharePoint online
BA08 - Agile for Business Analysts
By Nexus Human
Duration 2 Days 12 CPD hours This course is intended for Anyone with the need to understand how business analysis is performed to support agile projects or who must transition their existing business analysis skills and practices from waterfall to agile. Overview In this course, students will: Understand the fundamentals of agile delivery and agile business analysis Compare and contrast business analysis on waterfall and agile projects Explain the value proposition for agile product development Define the 4 main types of project life cycles Complete an in-depth walkthrough of the agile delivery life cycle Explain the major flavors of agile Understand the major standards available to assist in transition of skills Define business analysis tailoring and understand how to apply it Learn over 20 business analysis techniques commonly used on agile projects In this course, students will gain an understanding about agile business analysis. Students will learn how business analysis on an agile project is ?the same? and ?different? than business analysis performed on waterfall projects. Students will understand how the business analysis role changes on an agile team. A number of business analysis techniques suited for supporting agile teams will be introduced as will the various standards available to the community to help teams and organizations transition. Since few organizations are pure agile, students will also learn about delivery approaches that use a combination of practices from waterfall and agile and will also be introduced to the important concept of business analysis tailoring ? the key skill used to adapt business analysis skills to all environments ? regardless of the delivery life cycle selected. Introduction What is agile The Agile Manifesto Agile principles Agile benefits Hands-on activity Learning and course objectives The current state of agile Agile trends Agile skills Value proposition The business case for agile The BA role changes on an agile project Hands-on activity Understanding project life cycles Project life cycle Product life cycle Incremental versus Iterative Hybrid approaches to delivery Choosing a project life cycle An in-depth look at Agile The agile development life cycle A sequence of iterations Essential concepts Inside each iteration Iteration goal Iteration planning Sequence of tasks Work period Testing End of iteration activities Evaluation and feedback Structured walkthroughs Evaluation guidelines The BA role in structured walkthroughs Scripting scenarios Defect list Retrospectives Hands-on exercise Type of Agile Delivery Approaches The flavors of agile Scrum Scrum roles Extreme Programming (XP) Dynamic System Development Method (DSDM) Feature Driven Development (FDD) Testing Best practices used by FDD Kanban Kanban Boards Agile Unified Process Scaling Frameworks Introduction to Agile Business Analysis What is business analysis? What is agile business analysis? Framework for agile business analysis Business analysis components International Institute of Business Analysis (IIBA©) Project Management Institute (PMI©) Context to business analysis Our industry BA standards Our industry Agile BA standards Product Owners What stays the same What is expected to change Agile requirements deliverables Lightweight documentation Requirements repository Where business analysis fits in The BA workload Hands-on exercise Business Analysis Tailoring Business analysis tailoring (defined) Tailoring considerations What tailoring looks like The PMI Guide to Business Analysis Determining the ?best? BA approach Methodology vs Standard Why use methodologies Determining your methodology Business analysis impacts Tools and techniques for agile business analysis Agile BA techniques Backlog refinements Behavior Driven Development (BDD) Burndown chart Collaborative games Definition of done Definition of ready INVEST Iteration planning Kanban board Minimum marketable features (MMF) Minimum viable product (MVP) MoSCoW Narrative writing Persona analysis Product roadmap Progressive Elaboration Prototyping Purpose alignment model Retrospectives Story slicing Hands-on Exercise Prioritization Techniques Requirements prioritization Prioritizing on agile projects Prioritization criteria Business benefit MoSCoW Pair-choice comparison Setting priorities with multi-voting Cost to acquire and operate Determining business value Story point estimating Planning poker Project velocity Hands-on activity Course wrap-up Making the transition to agile How my role will be different Course summary Retrospective Questions Additional course details: Nexus Humans BA08 - Agile for Business Analysts training program is a workshop that presents an invigorating mix of sessions, lessons, and masterclasses meticulously crafted to propel your learning expedition forward. This immersive bootcamp-style experience boasts interactive lectures, hands-on labs, and collaborative hackathons, all strategically designed to fortify fundamental concepts. Guided by seasoned coaches, each session offers priceless insights and practical skills crucial for honing your expertise. Whether you're stepping into the realm of professional skills or a seasoned professional, this comprehensive course ensures you're equipped with the knowledge and prowess necessary for success. While we feel this is the best course for the BA08 - Agile for Business Analysts course and one of our Top 10 we encourage you to read the course outline to make sure it is the right content for you. Additionally, private sessions, closed classes or dedicated events are available both live online and at our training centres in Dublin and London, as well as at your offices anywhere in the UK, Ireland or across EMEA.
Power BI Introduction
By Underscore Group
Learn how to use this powerful tool to import and clean data and create some amazing visuals. Course overview Duration: 2 days (13 hours) Power BI Desktop is a powerful tool for working with your data. It enables you to import multiple data sources and create effective visualisations and reports. This course is an introduction to Power BI to get you started on creating a powerful reporting capability. You should have a good working knowledge of Excel and managing data before attending. Objectives By the end of the course you will be able to: Import data from multiple data sources Edit and transform data before importing Create reports Create different visualisations Create data models Build data relationships Use the drill down features Create measures Use the Power BI Service Build dashboards Use the mobile app Content Essentials Importing Data Power BI Overview Data sources Importing data Transforming Your Data Editing your data Setting data types Removing columns/rows Choosing columns to keep Setting header rows Splitting columns Creating Reports Creating and saving reports Adding pages Renaming pages Interactivity Refreshing your data Adding Columns Columns from example Custom columns Conditional columns Append Queries Importing folders Setting up and using append queries Creating Chart Visualisations Adding chart elements Choosing chart types Setting properties Setting values, axis and legends Using tooltips Visual filters Setting page and report filters Creating Tables, Cards, Gauges and Maps Adding table elements Adding maps Working with cards Working with matrices KPIs and Gauges Conditional Formatting Setting rules Removing conditional formatting Working with Data Models Merge Queries Setting up and using merge queries Merging in columns of data Creating a Data Model The data model Multiple data tables Connecting tables Building relationships Relationship types Building visuals from multiple tables Unpivoting Data Working with summary data Unpivoting data Using Hierarchies Using built in hierarchies Drill down Drill up See next level Expand a hierarchy Create a new hierarchy Grouping Grouping text fields Grouping date and number fields Creating Measures DAX functions DAX syntax Creating a new measure Using quick measures Using the PowerBI Service Shared workspaces My workspace Dashboards Reports Datasets Drill down in dashboards Focus mode Using Q&A Refreshing data Using Quick Insights Power BI Mobile App Using the Power BI Mobile App
