- Professional Development
- Medicine & Nursing
- Arts & Crafts
- Health & Wellbeing
- Personal Development
368 Analytics courses in London delivered Live Online
ICM-WA-CT-Installing and Configuring Meraki MR Wireless Aps
By Nexus Human
Duration 3 Days 18 CPD hours This course is intended for The primary audience for this course is as follows: IT Staff and Managers Network and systems personnel and engineers Small to mid-sized organizations that require fundamental knowledge on networking terms/concepts and configuration guidance for Meraki equipment. This also includes organizations looking to implement remote sites, provide a guest wireless solution, and collect user analytics. Overview Following completion of this course, students will understand, Install, Configure, Monitor, and Troubleshoot the following: Navigate and Configure the dashboard Add MX/MR/MS/MV devices to the Dashboard Understand and Configure Configuration Templates Understand and Configure Group Policies Manage/Configure/Integrate Users and Radius Policies Configure, Monitor, and Troubleshoot MR Access Points Monitor Meraki Network Health Troubleshoot devices and Connectivity This 3-day Cisco course provide students with the skills to configure, optimize, and troubleshoot a Cisco Meraki solution. Students will learn how to install and optimize Meraki MR Access Points. Students will also learn how to configure the Meraki Dashboard, troubleshoot and configure the Meraki environment and learn how to diagnose and resolve user and Network issues that may arise. Introduction to Meraki The Meraki Mission Cisco Meraki: Bringing the Cloud to Enterprise Networks Cloud-Managed Networking Architecture Benefits of a Cloud-Based Solution The Meraki Full Stack: New and Unique Value Proposition Meraki Deployment ? How it works Why Customers Choose Meraki Meraki MS Switches Overview Meraki MX Security Appliances Overview Meraki SD-WAN Overview Meraki MR Wireless Access Points Overview Cisco Meraki Systems Manager Overview Cisco Meraki MV Vision Security Cameras Overview Meraki API Overview Meraki Licensing Enterprise Support Cisco Meraki Documentation Cloud Management with the Meraki Dashboard The Meraki Dashboard Dashboard: Organizational Structure Out-of-band Cloud Management Loss of Connectivity to the Cisco Meraki Cloud Meraki Dashboard Logins Create Dashboard Accounts and Organization MSP Logins - Manage Multiple Organizations Modify an Organization View Organizations Health Meraki Dashboard Best Practices Dashboard Search Meraki Help Organizational Wide Settings Configure Monitor Create and Manage Configuration Templates Network-Wide Settings Configure Meraki MR Wireless Meraki MR Wireless Overview Meraki 2.5G Multigigabit (MGig) Wireless Meraki Mesh Routing Meraki?s solution for RF Environments Securing Guest Wireless Bluetooth Integrated Analytics Meraki Location Heatmap High Density Wireless Zero-Touch Provisioning for Wireless Dedicated Scanning Radio for Rouges and Interference Mounting indoor and Outdoor Antennas Meraki MR Licensing IEEE 802.11 Wireless LAN Standards Site Survey & Design for ensuring connectivity and user experience Meraki AP Models Overview Configuring Meraki APs Configuring SSIDs Firewall & Traffic Shaping Configuration for Wireless Monitoring Meraki APs Trouble Shooting

Smart Metering & Power Quality Analytics
By EnergyEdge - Training for a Sustainable Energy Future
About this training course The smart meter or smart grid represents the next-generation electrical power system. This system uses information, data & communication technology within generation, delivery and consumption of electric energy. This 4-day course will equip you with the innovations that are shaping the power generation and distribution systems and will cover topics ranging from Smart Metering Architecture, Cybersecurity, Smart Grid Systems and Power Line Communications. Training Objectives By participating in this course, you will be able to: Comprehend the Smart Grid and Smart Meters architecture Review latest trends and challenges within the Smart Grid Technology Perform analysis on smart electronic meters Comply with regulatory and metering standards Recognize the importance of cybersecurity in smart grids Maximize efficiency, reliability, and longevity of your smart meters and equipment Gain valuable insights into power quality and harmonics Target Audience This course will greatly benefit the following groups but not limited to: Smart Grid managers and engineers Smart Meters managers and engineers Power plant managers Outage managers Maintenance and operations engineers Power regulatory personnel Transmission managers and engineers Distribution managers and engineers IT managers Renewable energy managers and engineers Course Level Basic or Foundation Intermediate Training Methods The training instructor relies on a highly interactive training method to enhance the learning process. This method ensures that all participants gain a complete understanding of all the topics covered. The training environment is highly stimulating, challenging, and effective because the participants will learn by case studies which will allow them to apply the material taught in their own organization. Course Duration: 4 days in total (28 hours). Training Schedule 0830 - Registration 0900 - Start of training 1030 - Morning Break 1045 - Training recommences 1230 - Lunch Break 1330 - Training recommences 1515 - Evening break 1530 - Training recommences 1700 - End of Training The maximum number of participants allowed for this training course is 25. This course is also available through our Virtual Instructor Led Training (VILT) format. Trainer Your expert course leader is a professional engineer with extensive experience in power system studies, substation design field-testing, and EHS programs settings for Mining and Electrical Utilities sectors. He was formally the Engineering Manager at GE Canada in Ontario. He received his M.Sc. in electrical engineering from the University of New Brunswick and his MBA from Laurier School of Business in Waterloo. He has managed and executed more than 150 engineering projects on substation design EMF audits and power system studies and analyses, EMF audits and grounding audits, for major electrical utilities, mines, oil and gas, data centers, industrial and commercial facilities in Canada and the U.S. He is a certified professional engineer in the provinces of Ontario and Alberta. He has various IEEE publications, has served as a technical reviewer for many IEEE journals in power systems and control systems, and is the chair of the Industry Application Chapter (IAS) for IEEE Toronto Section. He remains a very active member for the IEEE substation committee of IEEE Std. 81 ground testing (WGE6) and IEEE Std. 80 ground design (WGD7). A certified electrical safety trainer by GE Corporate and a Canadian Standard Association (CSA) committee member at the mining advisory panel for electrical safety, he also taught many technical courses all over Canada to industrial customers, electrical consultants as well as to electrical utilities customers. Highlighted Projects: Various Power System Studies for 345/230 kV Stations - Nova Scotia Power (EMERA) RF audits for Telecom tower and antennas - Cogeco/Rogers Mobile Power System analysis - Powell Canada Structural/Geotechnical Design and upgrades - Oakville Hydro Underground Cables testing and sizing - Plan Group Relay programming and design optimization - Cenovus Canada Different Arc Flash Analysis and BESS Design - SNC Lavalin Environmental site assessment (ESA) Phase I/II for multiple stations - Ontario Electromagnetic compatibility (EMC) assessment for Toronto LRT expansion - MOSAIC Battery energy storage system (BESS) installation at City of London - Siemens Canada EMF audits for 500 kV Transmission Lines - Hydro One EMF audits for 500 kV Transmission Lines - Hydro Quebec AC interference for 138 kV line modeling and mitigations - HBMS Mine POST TRAINING COACHING SUPPORT (OPTIONAL) To further optimise your learning experience from our courses, we also offer individualized 'One to One' coaching support for 2 hours post training. We can help improve your competence in your chosen area of interest, based on your learning needs and available hours. This is a great opportunity to improve your capability and confidence in a particular area of expertise. It will be delivered over a secure video conference call by one of our senior trainers. They will work with you to create a tailor-made coaching program that will help you achieve your goals faster. Request for further information post training support and fees applicable Accreditions And Affliations

ICM-MXSA-CT-Installing and Configuring Meraki MX Security Appliances
By Nexus Human
Duration 3 Days 18 CPD hours This course is intended for The primary audience for this course is as follows: IT Staff and Managers Network and systems personnel and engineers Small to mid-sized organizations that require fundamental knowledge on networking terms/concepts and configuration guidance for Meraki equipment. This also includes organizations looking to implement remote sites, provide a guest wireless solution, and collect user analytics. Overview Following completion of this course, students will understand, Install, Configure, monitor, and Troubleshoot the following: Navigate and Configure the dashboard Add MX/MR/MS/MV devices to the Dashboard Understand and Configure Configuration Templates Understand and Configure Group Policies Manage/Configure/Integrate Users and Radius Policies Configure, Monitor, and Troubleshoot MX Firewalls Troubleshoot devices and Connectivity This 3-day Cisco course provide students with the skills to configure, optimize, and troubleshoot a Cisco Meraki solution. Students will learn how to install and optimize Meraki MX Firewalls. Students will also learn how to configure the Meraki Dashboard Students will troubleshoot and configure the Meraki environment and learn how to diagnose and resolve user and Network issues that may arise. Introduction to Meraki The Meraki Mission Cisco Meraki: Bringing the Cloud to Enterprise Networks Cloud-Managed Networking Architecture Benefits of a Cloud-Based Solution The Meraki Full Stack: New and Unique Value Proposition Meraki Deployment ? How it works Why Customers Choose Meraki Meraki MS Switches Overview Meraki MX Security Appliances Overview Meraki SD-WAN Overview Meraki MR Wireless Access Points Overview Cisco Meraki Systems Manager Overview Cisco Meraki MV Vision Security Cameras Overview Meraki API Overview Meraki Licensing Enterprise Support Cisco Meraki Documentation Cloud Management with the Meraki Dashboard The Meraki Dashboard Dashboard: Organizational Structure Out-of-band Cloud Management Loss of Connectivity to the Cisco Meraki Cloud Meraki Dashboard Logins Create Dashboard Accounts and Organization MSP Logins - Manage Multiple Organizations Modify an Organization View Organizations Health Meraki Dashboard Best Practices Dashboard Search Meraki Help Organizational Wide Settings Configure Monitor Create and Manage Configuration Templates Network-Wide Settings Configure Meraki MX Security Benefits of a Cloud Managed Security Solution Threat Management Solution Advanced Security Licenses Reliable, Cost Effective Connectivity with Meraki SD-WAN Site-to-Site VPN (Auto VPN) High Availability and Path Redundancy Application-Aware Intelligent Path Control Traffic Monitoring and Analytics Integrating Active Directory Cisco Meraki MX Models and Features Configuring the Local Status Page Adding Appliance to Network Device Configuration Configuring the Warm Spare Feature Device Tags & Notes Configuring Addressing & VLANs DHCP Server Configuration and Options Meraki Firewall Configuration Meraki Site-to-Site VPN One Arm VPN Concentrator Configuration Meraki Client VPN Meraki Active Directory Integration Meraki Access Control Meraki Splash Page Configuration Configuring Access Policies Teleworker VPN/L3 Roaming
Power BI® - Business Data Analytics
By EnergyEdge - Training for a Sustainable Energy Future
About this Training Course This 3 full-day training course will introduce participants to the Microsoft Power BI® software solution for extracting, manipulating, visualising and analysing data. This is a very practical, hands-on course that takes participants through a series of exercises which help users understand the Power BI® environment, how to use the key areas of functionality, and how to apply the tools it contains to design and produce analyses of their own data. The first two days focus on learning the key concepts and practising these using clean, simple datasets. The third day provides participants with the opportunity to apply what they've learned to their own data. This makes the course far more relevant and meaningful for them, it allows our facilitator to help them structure their data models, queries and DAX formulas correctly, and it allows our facilitator to help them solve any additional problems that may arise but which were not covered as part of the standard the course. In addition, at the end of the day, each participant walks away with something of real, practical use for their job role. Many previous participants have remarked that they obtained the most value from the course during the third day because otherwise, they wouldn't be able to do what they need to do. This is an introductory course and although it does not assume any prior experience with Power BI®, participants will gain much more from the course if they have at least used Power BI® a little prior to attending. Participants who have taught themselves Power BI® will also benefit from attending as the course will fill-in a number of gaps in their knowledge and will also extend what they know. A general understanding of databases, Excel formulas, and Excel Pivot Tables is useful though not essential. Comprehensive course notes, exercises and completed solutions are included. Microsoft® PowerBI® is a trademark of Microsoft Corporation in the United States and/or other countries. Training Objectives Upon completion of this training course, participants will be able to: Confidently use the Power BI® solution, including Power BI® Desktop, PowerBI®.com and the Power BI® Gateway Extract data from a variety of data sources and manipulate the data extracted so it is ready for analysis Combine data sources together and gain an introductory understanding of the M language Write formulas using the DAX language for generating custom columns, measures and tables Design reports and dashboards using a wide range of both built-in and custom visuals Publish reports and dashboards to PowerBI®.com Share reports and dashboards with others using PowerBI®.com Customize reports and dashboards so that different user groups automatically see their own personalized views Target Audience This training course is intended for: Financial Analysts Accountants Budgeting and planning specialists Treasury Risk Managers Strategic Planners This is an introductory course and although it does not assume any prior experience with Power BI®, participants will gain much more from the course if they have at least used Power BI® a little prior to attending. Participants who have taught themselves Power BI® will also benefit from attending as the course will fill-in a number of gaps in their knowledge and will also extend what they know. A general understanding of databases, Excel formulas, and Excel Pivot Tables is useful though not essential. Comprehensive course notes, exercises and completed solutions are included. Course Level Basic or Foundation Trainer Your expert course leader has a Masters (Applied Finance & Investment), B.Comm (Accounting & Information Systems), CISA, FAIM, F Fin and is a Microsoft Certified Excel Expert. He has over 20 years' experience in financial modelling, forecasting, valuation, model auditing, and management reporting for clients throughout the world. He is skilled in the development and maintenance of analytical tools and financial models for middle-market companies to large corporates, at all levels of complexity, in both domestic and international settings. He has trained delegates from a wide variety of Oil & Gas companies including Chevron, Woodside, BHP Billiton, Petronas, Carigali, Shell, Nippon, Eni, Pertamina, Inpex, and many more. He provides training in financial modelling for companies throughout the Asia, Oceania, Middle East and African regions. Before his current role, he spent 6 years working in the Corporate and IT Consulting divisions of a large, multinational Chartered Accounting firm. He is the author of a number of white papers on financial modelling on subjects such as Financial Modelling Best Practices and Financial Model Auditing. Highlights from his oil and gas experience include: Development of economic models to assist Decision Analysts modelling for a wide range of scenarios for multinational oil & gas assets. Auditing and further development of life of project models for Chevron's Strategic Planning Division analysing their North West Shelf assets. Development of business plan and budgeting models for multinational oil & gas assets. Development of cash flow and taxation models for a variety of oil gas companies. Consulting on Sarbanes Oxley spreadsheet remediation and risk assessment. POST TRAINING COACHING SUPPORT (OPTIONAL) To further optimise your learning experience from our courses, we also offer individualized 'One to One' coaching support for 2 hours post training. We can help improve your competence in your chosen area of interest, based on your learning needs and available hours. This is a great opportunity to improve your capability and confidence in a particular area of expertise. It will be delivered over a secure video conference call by one of our senior trainers. They will work with you to create a tailor-made coaching program that will help you achieve your goals faster. Request for further information post training support and fees applicable Accreditions And Affliations
Cisco Managing SAN Infrastructure with Cisco Data Center Network Manager v1.0 (DCNMS)
By Nexus Human
Duration 2 Days 12 CPD hours This course is intended for IT professionals interested in understanding the capabilities of the MDS 9000 Series using Cisco DCNM. IT professionals seeking a deeper knowledge of SAN operations using both CLI and DCNM may take the alternative 4-day course, Configuring Cisco MDS 9000 Series Switches (DCMDS). Much of the hands-on work in DCNMS is also covered in DCMDS. This course is also designed for professionals in the following roles including: Consulting systems engineer Data center engineers Data center operators Data center network management engineers Storage network administrator Network administrator Network engineer Sales engineer Technical solutions architect Overview After taking this course, you should be able to: Describe Cisco DCNM SAN components, licensing, high availability, and security features Describe Cisco DCNM SAN reports, alerts, event forwarding, and troubleshooting tools, including Cisco DCNM SAN Insights and SAN Analytics features The Managing SAN Infrastructure with Cisco© Data Center Network Manager (DCNMS) v1.0 course provides product training that that teaches you to deploy, operate, and maintain the Cisco Data Center Network Manager (DCNM) SAN solutions. You will learn to configure, monitor, and troubleshoot Cisco storage networking infrastructure using Cisco DCNM. Cisco DCNM provides management, automation, visualization, and troubleshooting across Cisco Nexus© and Cisco Multilayer Distributed Switching (MDS) solutions.You will learn how the DCNM serves as a Storage Area Network (SAN) solution for managing and troubleshooting Cisco storage architecture. Implementing Cisco DCNM SAN Cisco DCNM Solution Overview Implement Cisco DCNM SAN Integrate Cisco DCNM SAN with VMware vCenter Cisco DCNM SAN Licensing Monitoring and Troubleshooting SAN Infrastructure Using Cisco DCNM SAN Cisco DCNM SAN Alerts and Reports Dashboards in Cisco DCNM SAN SAN Troubleshooting with the Cisco DCNM SAN Analytics and Telemetry Streaming Additional course details: Nexus Humans Cisco Managing SAN Infrastructure with Cisco Data Center Network Manager v1.0 (DCNMS) training program is a workshop that presents an invigorating mix of sessions, lessons, and masterclasses meticulously crafted to propel your learning expedition forward. This immersive bootcamp-style experience boasts interactive lectures, hands-on labs, and collaborative hackathons, all strategically designed to fortify fundamental concepts. Guided by seasoned coaches, each session offers priceless insights and practical skills crucial for honing your expertise. Whether you're stepping into the realm of professional skills or a seasoned professional, this comprehensive course ensures you're equipped with the knowledge and prowess necessary for success. While we feel this is the best course for the Cisco Managing SAN Infrastructure with Cisco Data Center Network Manager v1.0 (DCNMS) course and one of our Top 10 we encourage you to read the course outline to make sure it is the right content for you. Additionally, private sessions, closed classes or dedicated events are available both live online and at our training centres in Dublin and London, as well as at your offices anywhere in the UK, Ireland or across EMEA.
Cisco Introduction to SD-Access and DNA Center (SDAINT)
By Nexus Human
Duration 2 Days 12 CPD hours This course is intended for The primary audience for this course is as follows:Anyone interested in knowing about DNA Center and SD-AccessPersonnel involved in SD-Access Design and ImplementationNetwork Operations team with SD-Access solutionNetwork admin staff that deal with User AccessChannel Partner SEs and other sales supportNetwork Access Control administrationNetwork AdministratorsNetwork ArchitectsNetwork Engineers Overview Upon completing this course, the learner will be able to meet these overall objectives:Know and understand Cisco?s SD-Access concepts, features, benefits, terminology and the way this approach innovates common administrative tasks on today?s networks.Differentiate and explain each of the building blocks of SD-Access SolutionExplain the concept of ?Fabric? and the different node types that conform it (Fabric Edge Nodes, Control Plane Nodes, Border Nodes)Describe the role of LISP in Control Plane and VXLAN in Data Plane for SD-Access SolutionUnderstand the role of DNA Center as solution orchestrator and Intelligent GUIBe familiar with workflow approach in DNA Center and its 4 Steps: Design, Policy, Provision and Assurance DNA Center and SD-Access offer Cisco?s next-generation programmable digital network to help automate common network access security features and streamline the redundant, complex configuration required to allow different groups of users access to the network infrastructure. This network security training course allows network administrators to quickly allow differentiated access for end users on the network while allowing the network to react automatically to day zero and other types of attacks. Introduction to Cisco?s Software Defined Access (SD-Access) SD-Access Overview SD-Access Benefits SD-Access Key Concepts SD-Access Main Components SD-Access Campus Fabric The concept of Fabric Node types Fabric Edge Nodes Control Plane Nodes Border Nodes LISP as protocol for Control Plane VXLAN as protocol for Data Plane Concept of Virtual Network Fabric-enabled WLAN DNA Center and Workflow for SD-Access Introduction to DNA Center Workflow for SD-Access in DNA Center Integration with Cisco ISE for Policy Enforcement Integration with Cisco NDP for Analytics and Assurance Relationship with APIC-EM controller DNA Center Workflow First Step - Design Creating Enterprise and Sites Hierarchy Discuss and Demonstrate General Network Settings Loading maps into the GUI IP Address Administration Administering Software Images Network Device Profiles DNA Center Workflow Second Step - Policy 2-level Hierarchy Policy Types ISE Integration with DNA Center Cross Domain Policies DNA Center Workflow Third Step - Provision Devices Onboarding Fabric Domains Adding Nodes DNA Center Workflow Fourth Step ? Assurance Introduction to Analytics NDP Fundamentals Overview of DNA Assurance Components of DNA Assurance DNA Center Assurance Dashboard Implementing WLAN in SD-Access Solution WLAN Integration Strategies in SD-Access Fabric SD-Access Wireless Architecture Sample Design for SD-Access Wireless Campus Fabric External Connectivity for SD-Access Enterprise Sample Topology for SD-Access Role of Border Nodes Types of Border Nodes Single Border vs. Multiple Border Designs Collocated Border and Control Plane Nodes Distributed (separated) Border and Control Plane Nodes
Introduction to SQL Programming Basics (TTSQL002)
By Nexus Human
Duration 3 Days 18 CPD hours This course is intended for This is an introductory level SQL course, appropriate for anyone needing to interface with an Oracle database or those needing a general understanding of Oracle database functionality. That would include end users, business analysts, application developers and database administrators. Overview Working in a hands on learning environment led by our expert practitioner, attendees will explore: Basic RDBMS Principles The SQL Language and Tools Using SQL Developer SQL Query Basics WHERE and ORDER BY Functions ANSI 92 Joins ANSI 99 Joins Subqueries Regular Expressions Analytics A company?s success hinges on responsible, accurate database management. Organizations rely on highly available data to complete all sorts of tasks, from creating marketing reports and invoicing customers to setting financial goals. Data professionals like analysts, developers and architects are tasked with creating, optimizing, managing and analyzing data from databases ? with little room for error. When databases aren?t built or maintained correctly, it?s easy to mishandle or lose valuable data. Our SQL Programming and Database Training Series provides students with the skills they require to develop, analyze and maintain data and in correctly structured, modern and secure databases. A full presentation of the basics of relational databases and their use are also covered. Basic RDBMS Principles Relational design principles Accessing data through a structured query language Entity relationship diagrams Data Domains Null values Indexes Views Denormalization Data Model Review The SQL Language and Tools Using SQL*Plus Why Use SQL*Plus When Other Tools Are Available? Starting SQL*Plus EZConnect SQL Commands PL/SQL Commands SQL*Plus Commands The COLUMN Command The HEADING Clause The FORMAT Clause The NOPRINT Clause The NULL Clause The CLEAR Clause Predefined define variables LOGIN.SQL Command history Copy and paste in SQL*Plus Entering SQL commands Entering PL/SQL commands Entering SQL*Plus commands Default output from SQL*Plus Entering Queries What about PL/SQL? Using SQL Developer Choosing a SQL Developer version Configuring connections Creating A Basic Connection Creating A TNS Connection Connecting Configuring preferences Using SQL Developer The Columns Tab The Data Tab The Constraints Tab The Grants Tab The Statistics Tab Other Tabs Queries In SQL Developer Query Builder Accessing Objects Owned By Other Users The Actions Pulldown Menu Differences between SQL Developer and SQL*Plus Reporting Commands Missing In SQL Developer General Commands Missing In SQL Developer Data Dictionary report User Defined reports Using scripts in SQL Developer WHERE and ORDER BY WHERE clause basics Comparison operators Literals and Constants in SQL Simple pattern matching Logical operations The DUAL table Arithmetic operations Expressions in SQL Character operators Pseudo columns Order by clause basics Ordering Nulls Accent and case sensitive sorts Sampling data WHERE and ORDER BY in SQL Developer All, Any, Some Functions The basics of Oracle functions Number functions Character functions Date functions Conversion functions Other functions Large object functions Error functions The RR format mode; Leveraging your knowledge ANSI 92 JOINS Basics of ANSI 92 Joins Using Query Builder with multiple tables Table Aliases Outer joins Outer Joins In Query Builder Set operators Self-referential joins Non-Equijoins ANSI 99 Joins Changes with ANSI99 CROSS Join NATURAL Join JOIN USING JOIN ON LEFT / RIGHT OUTER JOIN FULL OUTER JOIN Subqueries Why use subqueries? WHERE clause subqueries FROM clause subqueries HAVING clause subqueries CORRELATED subqueries SCALAR subqueries DML and subqueries EXISTS subqueries Hierarchical queries TOP N AND BOTTOM N queries Creating subqueries using Query Builder Regular Expressions Available Regular Expressions Regular Expression Operators Character Classes Pattern matching options REGEX_LIKE REGEXP_SUBSTR REGEXP_INSTR REGEXP_REPLACE REGEXP_COUNT Analytics The WITH clause Reporting aggregate functions Analytical functions User-Defined bucket histograms The MODEL clause PIVOT and UNPIVOT Temporal validity More Analytics RANKING functions RANK DENSE_RANK CUME_DIST PERCENT_RANK ROW_NUMBER Windowing aggregate functions RATIO_TO_REPORT LAG / LEAD Linear Regression functions Inverse Percentile functions Hypothetical ranking functions Pattern Matching Additional course details: Nexus Humans Introduction to SQL Programming Basics (TTSQL002) training program is a workshop that presents an invigorating mix of sessions, lessons, and masterclasses meticulously crafted to propel your learning expedition forward. This immersive bootcamp-style experience boasts interactive lectures, hands-on labs, and collaborative hackathons, all strategically designed to fortify fundamental concepts. Guided by seasoned coaches, each session offers priceless insights and practical skills crucial for honing your expertise. Whether you're stepping into the realm of professional skills or a seasoned professional, this comprehensive course ensures you're equipped with the knowledge and prowess necessary for success. While we feel this is the best course for the Introduction to SQL Programming Basics (TTSQL002) course and one of our Top 10 we encourage you to read the course outline to make sure it is the right content for you. Additionally, private sessions, closed classes or dedicated events are available both live online and at our training centres in Dublin and London, as well as at your offices anywhere in the UK, Ireland or across EMEA.
Tableau Desktop Training - Foundation
By Tableau Training Uk
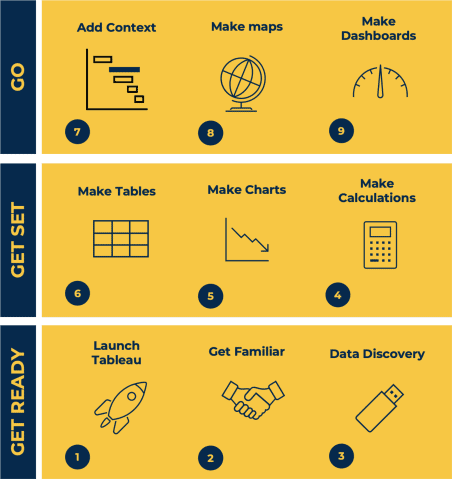
This Tableau Desktop Training course is a jumpstart to getting report writers and analysts with little or no previous knowledge to being productive. It covers everything from connecting to data, through to creating interactive dashboards with a range of visualisations in two days of your time. For Private options, online or in-person, please send us details of your requirements: This Tableau Desktop Training course is a jumpstart to getting report writers and analysts with little or no previous knowledge to being productive. It covers everything from connecting to data, through to creating interactive dashboards with a range of visualisations in two days of your time. Having a quick turnaround from starting to use Tableau, to getting real, actionable insights means that you get a swift return on your investment of time and money. This accelerated approach is key to getting engagement from within your organisation so everyone can immediately see and feel the impact of the data and insights you create. This course is aimed at someone who has not used Tableau in earnest and may be in a functional role, eg. in sales, marketing, finance, operations, business intelligence etc. The course is split into 3 phases and 9 modules: PHASE 1: GET READY MODULE 1: LAUNCH TABLEAU Check Install & Setup Why is Visual Analytics Important MODULE 2: GET FAMILIAR What is possible How does Tableau deal with data Know your way around How do we format charts Dashboard Basics – My First Dashboard MODULE 3: DATA DISCOVERY Connecting to and setting up data in Tableau How Do I Explore my Data – Filters & Sorting How Do I Structure my Data – Groups & Hierarchies, Visual Groups How Tableau Deals with Dates – Using Discrete and Continuous Dates, Custom Dates Phase 2: GET SET MODULE 4: MAKE CALCULATIONS How Do I Create Calculated Fields & Why MODULE 5: MAKE CHARTS Charts that Compare Multiple Measures – Measure Names and Measure Values, Shared Axis Charts, Dual Axis Charts, Scatter Plots Showing Relational & Proportional Data – Pie Charts, Donut Charts, Tree Maps MODULE 6: MAKE TABLES Creating Tables – Creating Tables, Highlight Tables, Heat Maps Phase 3: GO MODULE 7: ADD CONTEXT Reference Lines and Bands MODULE 8: MAKE MAPS Answering Spatial Questions – Mapping, Creating a Choropleth (Filled) Map MODULE 9: MAKE DASHBOARDS Using the Dashboard Interface Dashboard Actions This training course includes over 25 hands-on exercises and quizzes to help participants “learn by doing” and to assist group discussions around real-life use cases. Each attendee receives a login to our extensive training portal which covers the theory, practical applications and use cases, exercises, solutions and quizzes in both written and video format. Students must use their own laptop with an active version of Tableau Desktop 2018.2 (or later) pre-installed. What People Are Saying About This Course “Excellent Trainer – knows his stuff, has done it all in the real world, not just the class room.”Richard L., Intelliflo “Tableau is a complicated and powerful tool. After taking this course, I am confident in what I can do, and how it can help improve my work.”Trevor B., Morrison Utility Services “I would highly recommend this course for Tableau beginners, really easy to follow and keep up with as you are hands on during the course. Trainer really helpful too.”Chelsey H., QVC “He is a natural trainer, patient and very good at explaining in simple terms. He has an excellent knowledge base of the system and an obvious enthusiasm for Tableau, data analysis and the best way to convey results. We had been having difficulties in the business in building financial reports from a data cube and he had solutions for these which have proved to be very useful.”Matthew H., ISS Group
Data storytelling
By Fire Plus Algebra
Data has become the most important resource for every organisation – but the insights gained from data analysis will only ever be truly valuable if they can be clearly expressed to other people. This course is for anybody who works with data, and needs to communicate the meaning that's in the numbers to colleagues, customers, bosses or external stakeholders. It will give you or your team the confidence and skills to translate raw data into compelling visual stories for your key audiences. The principles and skills covered apply to the simplest PowerPoint chart, to more complex interactive visualisations. We’ll work with you before the course to ensure that we understand your organisation and what you’re hoping to achieve. Sample learning content Session 1: What makes a great data-driven story The key elements of a successful infographic or presentation. Industry best practice, and discussion of good (and bad) examples. A simple framework for identifying the Audience, Story and Action. Session 2: Data in context How to balance function and aesthetic appeal. Identifying the right graph, chart, infographic or other visual. Framing the data and providing contextual information. Session 3: Designing for the human brain Using colours to add emphasis and meaning. Design and layout principles, and creating hierarchies of information. The principle of ‘self-sufficiency’, and removing clutter. Session 4: Navigation and narrative Tailoring visualisations for different types of communications. Structuring presentations and longer reports. Thinking in layers to create interactive dashboards. Delivery We deliver our courses over Zoom, to maximise flexibility. The training can be delivered in a single day, or across multiple sessions. All of our courses are live and interactive – every session includes a mix of formal tuition and hands-on exercises. To ensure this is possible, the number of attendees is capped at 16 people. Tutor Alan Rutter is the founder of Fire Plus Algebra. He is a specialist in communicating complex subjects through data visualisation, writing and design. He teaches for General Assembly and runs in-house training for public sector clients including the Home Office, the Department of Transport, the Biotechnology and Biological Sciences Research Council, the Health Foundation, and numerous local government and emergency services teams. He previously worked with Guardian Masterclasses on curating and delivering new course strands, including developing and teaching their B2B data visualisation courses. He oversaw the iPad edition launches of Wired, GQ, Vanity Fair and Vogue in the UK, and has worked with Condé Nast International as product owner on a bespoke digital asset management system for their 11 global markets. Testimonial “I was familiar with Alan’s work as a Guardian Masterclass instructor on data visualisation and digital journalism, which made it easy for me to recommend him for onsite training at the Liverpool School of Tropical Medicine. We had a large group of people interested in honing their abilities to depict their research and stories in engaging ways. Alan’s course provided great insight about common communication pitfalls and how to avoid them, how to become better communicators by understanding the audience diversity, and it showcased some great online tools for creating infographics. This should be mandatory training for all students, academics, report writers and those involved with conveying research to the media as it will help increase the clarity and accessibility of our own research stories.” Dr Lee Haines | Liverpool School of Tropical Medicine

Overview Objective Understanding the Importance of Business Analysis Model Determining various techniques of Process Modelling Understanding the scope of modelling Efficiently mapping the business landscape Analysing the enterprise structure How to avoid project failures. Learning efficient skills of being a successful business analyst. Understand and document various techniques for the organization delivers value. Successful project conversion Building team, changing the organization and overcoming resistance. Creating an effective Business Case.