- Professional Development
- Medicine & Nursing
- Arts & Crafts
- Health & Wellbeing
- Personal Development
366 Analytics courses in Hale delivered Live Online
S4H400 SAP S/4HANA Embedded Analytics - Overview
By Nexus Human
Duration 2 Days 12 CPD hours This course is intended for Applications consultants, business analysts, business process owners, developer consultants, help desk consultants, project managers, and technology consultants. Overview This course will prepare you to: Give an overview of the S/4HANA embedded analytics architecture Explain the analytical offerings per user type Give an Introduction to SAP Best Practices for Analytics with SAP S/4HANA Explain the integration scenarios with SAP Business Warehouse In this course, students will gain an overview of the S/4HANA embedded analytics real-time operational reporting, its offerings per user type for the S/4HANA 610 and its integration with SAP Business Warehouse. Module 1 S/4HANA and S/4HANA embedded analytics introduction Module 2 S/4HANA embedded analytics architecture overview Module 3 Analytical Consumption Module 4 SAP Best Practices for Analytics with SAP S/4HANA Module 5 SAP Business Warehouse Integration Scenarios

Data Analytics Workflows for Artificial Lift, Production and Facility Engineers
By EnergyEdge - Training for a Sustainable Energy Future
About this training course Business Impact: The main aim is to provide insight and understanding of data analytics and machine learning principles through applications. Field data is used to explain data-analysis workflows. Using easy to follow solution scripts, the participants will assess and extract value from the data sets. Hands-on solution approach will give them confidence to try out applicable techniques on data from their field assets. Data analysis means cleaning, inspecting, transforming, and modeling data with the goal of discovering new, useful information and supporting decision-making. In this hands-on 2-day training course, the participants learn some data analysis and data science techniques and workflows applied to petroleum production (specifically artificial lift) while reviewing code and practicing. The focus is on developing data-driven models while keeping our feet closer to the underlying oil and gas production principles. Unique Features: Eight business use cases covering their business impact, code walkthroughs for most all and solution approach. Industry data sets for participants to practice on and take home. No software or complicated Python frameworks required. Training Objectives After the completion of this training course, participants will be able to: Understand digital oil field transformation and its impact on business Examine machine learning methods Review workflows and code implementations After completing the course, participants will have a set of tools and some pathways to model and analyze their data in the cloud, find trends, and develop data-driven models Target Audience This training course is suitable and will greatly benefit the following specific groups: Artificial lift, production and facilities engineers and students to enhance their knowledge base, increase technology awareness, and improve the facility with different data analysis techniques applied on large data sets Course Level Intermediate Advanced Training Methods The course discusses several business use-cases that are amenable to data-driven workflows. For each use case, the instructor will show the solution using a data analysis technique with Python code deployed in the Google cloud. Trainees will solve a problem and tweak their solution. Course Duration: 2 days in total (14 hours). Training Schedule 0830 - Registration 0900 - Start of training 1030 - Morning Break 1045 - Training recommences 1230 - Lunch Break 1330 - Training recommences 1515 - Evening break 1530 - Training recommences 1700 - End of Training The maximum number of participants allowed for this training course is 20. This course is also available through our Virtual Instructor Led Training (VILT) format. Prerequisites: Understanding of petroleum production concepts Knowledge of Python is not a must but preferred to get the full benefit. The training will use the Google Collaboratory environment available in Google-Cloud for hands-on exercises Trainees will need to bring a computer with a Google Chrome browser and a Google email account (available for free) Trainer Your expert course leader has over 35 years' work-experience in multiphase flow, artificial lift, real-time production optimization and software development/management. His current work is focused on a variety of use cases like failure prediction, virtual flow rate determination, wellhead integrity surveillance, corrosion, equipment maintenance, DTS/DAS interpretation. He has worked for national oil companies, majors, independents, and service providers globally. He has multiple patents and has delivered a multitude of industry presentations. Twice selected as an SPE distinguished lecturer, he also volunteers on SPE committees. He holds a Bachelor's and Master's in chemical engineering from the Gujarat University and IIT-Kanpur, India; and a Ph.D. in Petroleum Engineering from the University of Tulsa, USA. Highlighted Work Experience: At Weatherford, consulted with clients as well as directed teams on digital oilfield solutions including LOWIS - a solution that was underneath the production operations of Chevron and Occidental Petroleum across the globe. Worked with and consulted on equipment's like field controllers, VSDs, downhole permanent gauges, multiphase flow meters, fibre optics-based measurements. Shepherded an enterprise-class solution that is being deployed at a major oil and gas producer for production management including artificial lift optimization using real time data and deep-learning data analytics. Developed a workshop on digital oilfield approaches for production engineers. Patents: Principal inventor: 'Smarter Slug Flow Conditioning and Control' Co-inventor: 'Technique for Production Enhancement with Downhole Monitoring of Artificially Lifted Wells' Co-inventor: 'Wellbore real-time monitoring and analysis of fracture contribution' Worldwide Experience in Training / Seminar / Workshop Deliveries: Besides delivering several SPE webinars, ALRDC and SPE trainings globally, he has taught artificial lift at Texas Tech, Missouri S&T, Louisiana State, U of Southern California, and U of Houston. He has conducted seminars, bespoke trainings / workshops globally for practicing professionals: Companies: Basra Oil Company, ConocoPhillips, Chevron, EcoPetrol, Equinor, KOC, ONGC, LukOil, PDO, PDVSA, PEMEX, Petronas, Repsol, , Saudi Aramco, Shell, Sonatrech, QP, Tatneft, YPF, and others. Countries: USA, Algeria, Argentina, Bahrain, Brazil, Canada, China, Croatia, Congo, Ghana, India, Indonesia, Iraq, Kazakhstan, Kenya, Kuwait, Libya, Malaysia, Oman, Mexico, Norway, Qatar, Romania, Russia, Serbia, Saudi Arabia, S Korea, Tanzania, Thailand, Tunisia, Turkmenistan, UAE, Ukraine, Uzbekistan, Venezuela. Virtual training provided for PetroEdge, ALRDC, School of Mines, Repsol, UEP-Pakistan, and others since pandemic. POST TRAINING COACHING SUPPORT (OPTIONAL) To further optimise your learning experience from our courses, we also offer individualized 'One to One' coaching support for 2 hours post training. We can help improve your competence in your chosen area of interest, based on your learning needs and available hours. This is a great opportunity to improve your capability and confidence in a particular area of expertise. It will be delivered over a secure video conference call by one of our senior trainers. They will work with you to create a tailor-made coaching program that will help you achieve your goals faster. Request for further information post training support and fees applicable Accreditions And Affliations

55232 Writing Analytical Queries for Business Intelligence
By Nexus Human
Duration 3 Days 18 CPD hours This course is intended for This course is intended for information workers and data science professionals who seek to use database reporting and analysis tools such as Microsoft SQL Server Reporting Services, Excel, Power BI, R, SAS and other business intelligence tools, and wish to use TSQL queries to efficiently retrieve data sets from Microsoft SQL Server relational databases for use with these tools. Overview After completing this course, students will be able to: - Identify independent and dependent variables and measurement levels in their own analytical work scenarios. - Identify variables of interest in relational database tables. - Choose a data aggregation level and data set design appropriate for the intended analysis and tool. - Use TSQL SELECT queries to produce ready-to-use data sets for analysis in tools such as PowerBI, SQL Server Reporting Services, Excel, R, SAS, SPSS, and others. - Create stored procedures, views, and functions to modularize data retrieval code. This course is about writing TSQL queries for the purpose of database reporting, analysis, and business intelligence. 1 - INTRODUCTION TO TSQL FOR BUSINESS INTELLIGENCE Two Approaches to SQL Programming TSQL Data Retrieval in an Analytics / Business Intelligence Environment The Database Engine SQL Server Management Studio and the CarDeal Sample Database Identifying Variables in Tables SQL is a Declarative Language Introduction to the SELECT Query Lab 1: Introduction to TSQL for Business Intelligence 2 - TURNING TABLE COLUMNS INTO VARIABLES FOR ANALYSIS: SELECT LIST EXPRESSIONS, WHERE, AND ORDER BY Turning Columns into Variables for Analysis Column Expressions, Data Types, and Built-in Functions Column aliases Data type conversions Built-in Scalar Functions Table Aliases The WHERE clause ORDER BY Lab 1: Write queries 3 - COMBINING COLUMNS FROM MULTIPLE TABLES INTO A SINGLE DATASET: THE JOIN OPERATORS Primary Keys, Foreign Keys, and Joins Understanding Joins, Part 1: CROSS JOIN and the Full Cartesian Product Understanding Joins, Part 2: The INNER JOIN Understanding Joins, Part 3: The OUTER JOINS Understanding Joins, Part 4: Joining more than two tables Understanding Joins, Part 5: Combining INNER and OUTER JOINs Combining JOIN Operations with WHERE and ORDER BY Lab 1: Write SELECT queries 4 - CREATING AN APPROPRIATE AGGREGATION LEVEL USING GROUP BY Identifying required aggregation level and granularity Aggregate Functions GROUP BY HAVING Order of operations in SELECT queries Lab 1: Write queries 5 - SUBQUERIES, DERIVED TABLES AND COMMON TABLE EXPRESSIONS Non-correlated and correlated subqueries Derived tables Common table expressions Lab 1: Write queries 6 - ENCAPSULATING DATA RETRIEVAL LOGIC Views Table-valued functions Stored procedures Creating objects for read-access users Creating database accounts for analytical client tools Lab 1: Encapsulating Data Retrieval Logic 7 - GETTING YOUR DATASET TO THE CLIENT Connecting to SQL Server and Submitting Queries from Client Tools Connecting and running SELECT queries from: Excel PowerBI RStudio Exporting datasets to files using Results pane from SSMS The bcp utility The Import/Export Wizard Lab 1: Getting Your Dataset to the Client Additional course details: Nexus Humans 55232 Writing Analytical Queries for Business Intelligence training program is a workshop that presents an invigorating mix of sessions, lessons, and masterclasses meticulously crafted to propel your learning expedition forward. This immersive bootcamp-style experience boasts interactive lectures, hands-on labs, and collaborative hackathons, all strategically designed to fortify fundamental concepts. Guided by seasoned coaches, each session offers priceless insights and practical skills crucial for honing your expertise. Whether you're stepping into the realm of professional skills or a seasoned professional, this comprehensive course ensures you're equipped with the knowledge and prowess necessary for success. While we feel this is the best course for the 55232 Writing Analytical Queries for Business Intelligence course and one of our Top 10 we encourage you to read the course outline to make sure it is the right content for you. Additionally, private sessions, closed classes or dedicated events are available both live online and at our training centres in Dublin and London, as well as at your offices anywhere in the UK, Ireland or across EMEA.
Effective Data Visualisation
By Nexus Human
Duration 2 Days 12 CPD hours This course is intended for This course is aimed at anyone currently working with data who is interested in using data visualisation to more effectively communicate their results. Overview At completion, delegates will understand how data visualisations can be best used to communicate actionable insights from data and be competent with the tools required to do it. Visualising data, and analytics results, is one of the most effective ways to achieve this. This course will cover the theory of data visualisation along with practical skills for creating compelling visualisations from data. Course Outline The use of analytics, statistics and data science in business has grown massively in recent years. Harnessing the power of data is opening actionable insights in diverse industries from banking to horse breeding. The companies doing this most successfully understand that using sophisticated analytics approaches to unlock insights from data is only half the job. Communicating these insights to all of the different parts of an organisation is just as important as doing the actual analysis. Visualising data, and analytics results, is one of the most effective ways to achieve this. This course will cover the theory of data visualisation along with practical skills for creating compelling visualisations from data. To attend this course delegates should be competent in the use of data analysis tools such as reporting tools, spreadsheet software or business intelligence tools. The course will explore the following topics through a series of interactive workshop sessions: Fundamentals of data visualisation Data characteristics & dimensions Mapping visual encodings to data dimensions Colour theory Graphical perception & communication Interaction design Visualisation different characteristics of data: trends, comparisons, correlations, maps, networks, hierarchies, text Designing effective dashboards
DP-601T00 Implementing a Lakehouse with Microsoft Fabric
By Nexus Human
Duration 1 Days 6 CPD hours This course is intended for The primary audience for this course is data professionals who are familiar with data modeling, extraction, and analytics. It is designed for professionals who are interested in gaining knowledge about Lakehouse architecture, the Microsoft Fabric platform, and how to enable end-to-end analytics using these technologies. Job role: Data Analyst, Data Engineer, Data Scientist Overview Describe end-to-end analytics in Microsoft Fabric Describe core features and capabilities of lakehouses in Microsoft Fabric Create a lakehouse Ingest data into files and tables in a lakehouse Query lakehouse tables with SQL Configure Spark in a Microsoft Fabric workspace Identify suitable scenarios for Spark notebooks and Spark jobs Use Spark dataframes to analyze and transform data Use Spark SQL to query data in tables and views Visualize data in a Spark notebook Understand Delta Lake and delta tables in Microsoft Fabric Create and manage delta tables using Spark Use Spark to query and transform data in delta tables Use delta tables with Spark structured streaming Describe Dataflow (Gen2) capabilities in Microsoft Fabric Create Dataflow (Gen2) solutions to ingest and transform data Include a Dataflow (Gen2) in a pipeline This course is designed to build your foundational skills in data engineering on Microsoft Fabric, focusing on the Lakehouse concept. This course will explore the powerful capabilities of Apache Spark for distributed data processing and the essential techniques for efficient data management, versioning, and reliability by working with Delta Lake tables. This course will also explore data ingestion and orchestration using Dataflows Gen2 and Data Factory pipelines. This course includes a combination of lectures and hands-on exercises that will prepare you to work with lakehouses in Microsoft Fabric. Introduction to end-to-end analytics using Microsoft Fabric Explore end-to-end analytics with Microsoft Fabric Data teams and Microsoft Fabric Enable and use Microsoft Fabric Knowledge Check Get started with lakehouses in Microsoft Fabric Explore the Microsoft Fabric Lakehouse Work with Microsoft Fabric Lakehouses Exercise - Create and ingest data with a Microsoft Fabric Lakehouse Use Apache Spark in Microsoft Fabric Prepare to use Apache Spark Run Spark code Work with data in a Spark dataframe Work with data using Spark SQL Visualize data in a Spark notebook Exercise - Analyze data with Apache Spark Work with Delta Lake Tables in Microsoft Fabric Understand Delta Lake Create delta tables Work with delta tables in Spark Use delta tables with streaming data Exercise - Use delta tables in Apache Spark Ingest Data with DataFlows Gen2 in Microsoft Fabric Understand Dataflows (Gen2) in Microsoft Fabric Explore Dataflows (Gen2) in Microsoft Fabric Integrate Dataflows (Gen2) and Pipelines in Microsoft Fabric Exercise - Create and use a Dataflow (Gen2) in Microsoft Fabric
O3201 Fundamentals of IBM Watson Explorer Deep Analytics Edition oneWEX (V12.0.x)
By Nexus Human
Duration 2 Days 12 CPD hours This course is intended for This course is for analysts, developers, and administrators of IBM Watson Explorer Deep Analytics Edition oneWEX. Overview Identify oneWEX platformsIdentify the process and data flows of oneWEX projectsExplore the oneWEX user interfaceExplain ingestion and conversionUtilize Content MinerDefine enrichmentIdentify advanced features of oneWEX This course is designed to teach students core concepts of IBM Watson Explorer Deep Analytics Edition oneWEX. Students will learn to identify the oneWEX platforms as well as the process flow and data flow of oneWEX projects. Students will explore oneWEX tools, such as Content Miner and the Admin Console, while gaining hands-on experience in data acquisition and enrichment. Finally, students will be exposed to more advanced topics, such as Application Builder, Content Analytics Studio, and API usage. Overview of oneWEX Introduction to oneWEX Explore oneWEX architecture Identify installation options Navigation in oneWEX Explore the Admin Console Explore navigation using Content Miner The Collection detail view The REST API Data flow Explore the data flow of oneWEX Search and Analytics collection templates Identify data acquisition Data ingestion Work with datasets Work with crawlers Use an importer Explore conversion Data ingestion log files Analysis using oneWEX Content Miner Explore analysis using Content Miner The Guided Analysis Experience The Guided Analysis view Explore Annotators Enrichment using Annotators Annotator types Enrichment using Labeler Identify enrichment Identify document classification Classify using training data Classification versus clustering The document classification process Enrichment using Ranker Identify enrichment using Ranker The ranking process Migrate annotators from Content Analytics Studio Migrate Content Analytics Studio annotators Identify the UIMA pipeline configuration for oneWEX Update annotators Using Application Builder with oneWEX Application Builder and user roles Explore Application Builder Set up a oneWEX data source Functionality for oneWEX data sources Additional course details: Nexus Humans O3201 Fundamentals of IBM Watson Explorer Deep Analytics Edition oneWEX (V12.0.x) training program is a workshop that presents an invigorating mix of sessions, lessons, and masterclasses meticulously crafted to propel your learning expedition forward. This immersive bootcamp-style experience boasts interactive lectures, hands-on labs, and collaborative hackathons, all strategically designed to fortify fundamental concepts. Guided by seasoned coaches, each session offers priceless insights and practical skills crucial for honing your expertise. Whether you're stepping into the realm of professional skills or a seasoned professional, this comprehensive course ensures you're equipped with the knowledge and prowess necessary for success. While we feel this is the best course for the O3201 Fundamentals of IBM Watson Explorer Deep Analytics Edition oneWEX (V12.0.x) course and one of our Top 10 we encourage you to read the course outline to make sure it is the right content for you. Additionally, private sessions, closed classes or dedicated events are available both live online and at our training centres in Dublin and London, as well as at your offices anywhere in the UK, Ireland or across EMEA.
DP-900T00 Microsoft Azure Data Fundamentals
By Nexus Human
Duration 1 Days 6 CPD hours This course is intended for The audience for this course is individuals who want to learn the fundamentals of database concepts in a cloud environment, get basic skilling in cloud data services, and build their foundational knowledge of cloud data services within Microsoft Azure. Overview Describe core data concepts Identify considerations for relational data on Azure Describe considerations for working with non-relational data on Azure Describe an analytics workload on Azure In this course, students will gain foundational knowledge of core data concepts and related Microsoft Azure data services. Students will learn about core data concepts such as relational, non-relational, big data, and analytics, and build their foundational knowledge of cloud data services within Microsoft Azure. Students will explore fundamental relational data concepts and relational database services in Azure. They will explore Azure storage for non-relational data and the fundamentals of Azure Cosmos DB. Students will learn about large-scale data warehousing, real-time analytics, and data visualization. 1 - Explore core data concepts Identify data formats Explore file storage Explore databases Explore transactional data processing Explore analytical data processing 2 - Explore data roles and services Explore job roles in the world of data Identify data services 3 - Explore fundamental relational data concepts Understand relational data Understand normalization Explore SQL Describe database objects 4 - Explore relational database services in Azure Describe Azure SQL services and capabilities Describe Azure services for open-source databases 5 - Explore Azure Storage for non-relational data Explore Azure blob storage Explore Azure DataLake Storage Gen2 Explore Azure Files Explore Azure Tables 6 - Explore fundamentals of Azure Cosmos DB Describe Azure Cosmos DB Identify Azure Cosmos DB APIs 7 - Explore fundamentals of large-scale data warehousing Describe data warehousing architecture Explore data ingestion pipelines Explore analytical data stores 8 - Explore fundamentals of real-time analytics Understand batch and stream processing Explore common elements of stream processing architecture Explore Azure Stream Analytics Explore Apache Spark on Microsoft Azure 9 - Explore fundamentals of data visualization Describe Power BI tools and workflow Describe core concepts of data modeling Describe considerations for data visualization
SC-200T00 Microsoft Security Operations Analyst
By Nexus Human
Duration 4 Days 24 CPD hours This course is intended for The Microsoft Security Operations Analyst collaborates with organizational stakeholders to secure information technology systems for the organization. Their goal is to reduce organizational risk by rapidly remediating active attacks in the environment, advising on improvements to threat protection practices, and referring violations of organizational policies to appropriate stakeholders. Responsibilities include threat management, monitoring, and response by using a variety of security solutions across their environment. The role primarily investigates, responds to, and hunts for threats using Microsoft Sentinel, Microsoft Defender for Cloud, Microsoft 365 Defender, and third-party security products. Since the Security Operations Analyst consumes the operational output of these tools, they are also a critical stakeholder in the configuration and deployment of these technologies. Learn how to investigate, respond to, and hunt for threats using Microsoft Sentinel, Microsoft Defender for Cloud, and Microsoft 365 Defender. In this course you will learn how to mitigate cyberthreats using these technologies. Specifically, you will configure and use Microsoft Sentinel as well as utilize Kusto Query Language (KQL) to perform detection, analysis, and reporting. The course was designed for people who work in a Security Operations job role and helps learners prepare for the exam SC-200: Microsoft Security Operations Analyst. Prerequisites Basic understanding of Microsoft 365 Fundamental understanding of Microsoft security, compliance, and identity products Intermediate understanding of Windows 10 Familiarity with Azure services, specifically Azure SQL Database and Azure Storage Familiarity with Azure virtual machines and virtual networking Basic understanding of scripting concepts. 1 - Introduction to Microsoft 365 threat protection Explore Extended Detection & Response (XDR) response use cases Understand Microsoft Defender XDR in a Security Operations Center (SOC) Explore Microsoft Security Graph Investigate security incidents in Microsoft Defender XDR 2 - Mitigate incidents using Microsoft 365 Defender Use the Microsoft Defender portal Manage incidents Investigate incidents Manage and investigate alerts Manage automated investigations Use the action center Explore advanced hunting Investigate Microsoft Entra sign-in logs Understand Microsoft Secure Score Analyze threat analytics Analyze reports Configure the Microsoft Defender portal 3 - Protect your identities with Microsoft Entra ID Protection Microsoft Entra ID Protection overview Detect risks with Microsoft Entra ID Protection policies Investigate and remediate risks detected by Microsoft Entra ID Protection 4 - Remediate risks with Microsoft Defender for Office 365 Automate, investigate, and remediate Configure, protect, and detect Simulate attacks 5 - Safeguard your environment with Microsoft Defender for Identity Configure Microsoft Defender for Identity sensors Review compromised accounts or data Integrate with other Microsoft tools 6 - Secure your cloud apps and services with Microsoft Defender for Cloud Apps Understand the Defender for Cloud Apps Framework Explore your cloud apps with Cloud Discovery Protect your data and apps with Conditional Access App Control Walk through discovery and access control with Microsoft Defender for Cloud Apps Classify and protect sensitive information Detect Threats 7 - Respond to data loss prevention alerts using Microsoft 365 Describe data loss prevention alerts Investigate data loss prevention alerts in Microsoft Purview Investigate data loss prevention alerts in Microsoft Defender for Cloud Apps 8 - Manage insider risk in Microsoft Purview Insider risk management overview Create and manage insider risk policies Investigate insider risk alerts Take action on insider risk alerts through cases Manage insider risk management forensic evidence Create insider risk management notice templates 9 - Investigate threats by using audit features in Microsoft Defender XDR and Microsoft Purview Standard Explore Microsoft Purview Audit solutions Implement Microsoft Purview Audit (Standard) Start recording activity in the Unified Audit Log Search the Unified Audit Log (UAL) Export, configure, and view audit log records Use audit log searching to investigate common support issues 10 - Investigate threats using audit in Microsoft Defender XDR and Microsoft Purview (Premium) Explore Microsoft Purview Audit (Premium) Implement Microsoft Purview Audit (Premium) Manage audit log retention policies Investigate compromised email accounts using Purview Audit (Premium) 11 - Investigate threats with Content search in Microsoft Purview Explore Microsoft Purview eDiscovery solutions Create a content search View the search results and statistics Export the search results and search report Configure search permissions filtering Search for and delete email messages 12 - Protect against threats with Microsoft Defender for Endpoint Practice security administration Hunt threats within your network 13 - Deploy the Microsoft Defender for Endpoint environment Create your environment Understand operating systems compatibility and features Onboard devices Manage access Create and manage roles for role-based access control Configure device groups Configure environment advanced features 14 - Implement Windows security enhancements with Microsoft Defender for Endpoint Understand attack surface reduction Enable attack surface reduction rules 15 - Perform device investigations in Microsoft Defender for Endpoint Use the device inventory list Investigate the device Use behavioral blocking Detect devices with device discovery 16 - Perform actions on a device using Microsoft Defender for Endpoint Explain device actions Run Microsoft Defender antivirus scan on devices Collect investigation package from devices Initiate live response session 17 - Perform evidence and entities investigations using Microsoft Defender for Endpoint Investigate a file Investigate a user account Investigate an IP address Investigate a domain 18 - Configure and manage automation using Microsoft Defender for Endpoint Configure advanced features Manage automation upload and folder settings Configure automated investigation and remediation capabilities Block at risk devices 19 - Configure for alerts and detections in Microsoft Defender for Endpoint Configure advanced features Configure alert notifications Manage alert suppression Manage indicators 20 - Utilize Vulnerability Management in Microsoft Defender for Endpoint Understand vulnerability management Explore vulnerabilities on your devices Manage remediation 21 - Plan for cloud workload protections using Microsoft Defender for Cloud Explain Microsoft Defender for Cloud Describe Microsoft Defender for Cloud workload protections Enable Microsoft Defender for Cloud 22 - Connect Azure assets to Microsoft Defender for Cloud Explore and manage your resources with asset inventory Configure auto provisioning Manual log analytics agent provisioning 23 - Connect non-Azure resources to Microsoft Defender for Cloud Protect non-Azure resources Connect non-Azure machines Connect your AWS accounts Connect your GCP accounts 24 - Manage your cloud security posture management? Explore Secure Score Explore Recommendations Measure and enforce regulatory compliance Understand Workbooks 25 - Explain cloud workload protections in Microsoft Defender for Cloud Understand Microsoft Defender for servers Understand Microsoft Defender for App Service Understand Microsoft Defender for Storage Understand Microsoft Defender for SQL Understand Microsoft Defender for open-source databases Understand Microsoft Defender for Key Vault Understand Microsoft Defender for Resource Manager Understand Microsoft Defender for DNS Understand Microsoft Defender for Containers Understand Microsoft Defender additional protections 26 - Remediate security alerts using Microsoft Defender for Cloud Understand security alerts Remediate alerts and automate responses Suppress alerts from Defender for Cloud Generate threat intelligence reports Respond to alerts from Azure resources 27 - Construct KQL statements for Microsoft Sentinel Understand the Kusto Query Language statement structure Use the search operator Use the where operator Use the let statement Use the extend operator Use the order by operator Use the project operators 28 - Analyze query results using KQL Use the summarize operator Use the summarize operator to filter results Use the summarize operator to prepare data Use the render operator to create visualizations 29 - Build multi-table statements using KQL Use the union operator Use the join operator 30 - Work with data in Microsoft Sentinel using Kusto Query Language Extract data from unstructured string fields Extract data from structured string data Integrate external data Create parsers with functions 31 - Introduction to Microsoft Sentinel What is Microsoft Sentinel? How Microsoft Sentinel works When to use Microsoft Sentinel 32 - Create and manage Microsoft Sentinel workspaces Plan for the Microsoft Sentinel workspace Create a Microsoft Sentinel workspace Manage workspaces across tenants using Azure Lighthouse Understand Microsoft Sentinel permissions and roles Manage Microsoft Sentinel settings Configure logs 33 - Query logs in Microsoft Sentinel Query logs in the logs page Understand Microsoft Sentinel tables Understand common tables Understand Microsoft Defender XDR tables 34 - Use watchlists in Microsoft Sentinel Plan for watchlists Create a watchlist Manage watchlists 35 - Utilize threat intelligence in Microsoft Sentinel Define threat intelligence Manage your threat indicators View your threat indicators with KQL 36 - Connect data to Microsoft Sentinel using data connectors Ingest log data with data connectors Understand data connector providers View connected hosts 37 - Connect Microsoft services to Microsoft Sentinel Plan for Microsoft services connectors Connect the Microsoft Office 365 connector Connect the Microsoft Entra connector Connect the Microsoft Entra ID Protection connector Connect the Azure Activity connector 38 - Connect Microsoft Defender XDR to Microsoft Sentinel Plan for Microsoft Defender XDR connectors Connect the Microsoft Defender XDR connector Connect Microsoft Defender for Cloud connector Connect Microsoft Defender for IoT Connect Microsoft Defender legacy connectors 39 - Connect Windows hosts to Microsoft Sentinel Plan for Windows hosts security events connector Connect using the Windows Security Events via AMA Connector Connect using the Security Events via Legacy Agent Connector Collect Sysmon event logs 40 - Connect Common Event Format logs to Microsoft Sentinel Plan for Common Event Format connector Connect your external solution using the Common Event Format connector 41 - Connect syslog data sources to Microsoft Sentinel Plan for syslog data collection Collect data from Linux-based sources using syslog Configure the Data Collection Rule for Syslog Data Sources Parse syslog data with KQL 42 - Connect threat indicators to Microsoft Sentinel Plan for threat intelligence connectors Connect the threat intelligence TAXII connector Connect the threat intelligence platforms connector View your threat indicators with KQL 43 - Threat detection with Microsoft Sentinel analytics What is Microsoft Sentinel Analytics? Types of analytics rules Create an analytics rule from templates Create an analytics rule from wizard Manage analytics rules 44 - Automation in Microsoft Sentinel Understand automation options Create automation rules 45 - Threat response with Microsoft Sentinel playbooks What are Microsoft Sentinel playbooks? Trigger a playbook in real-time Run playbooks on demand 46 - Security incident management in Microsoft Sentinel Understand incidents Incident evidence and entities Incident management 47 - Identify threats with Behavioral Analytics Understand behavioral analytics Explore entities Display entity behavior information Use Anomaly detection analytical rule templates 48 - Data normalization in Microsoft Sentinel Understand data normalization Use ASIM Parsers Understand parameterized KQL functions Create an ASIM Parser Configure Azure Monitor Data Collection Rules 49 - Query, visualize, and monitor data in Microsoft Sentinel Monitor and visualize data Query data using Kusto Query Language Use default Microsoft Sentinel Workbooks Create a new Microsoft Sentinel Workbook 50 - Manage content in Microsoft Sentinel Use solutions from the content hub Use repositories for deployment 51 - Explain threat hunting concepts in Microsoft Sentinel Understand cybersecurity threat hunts Develop a hypothesis Explore MITRE ATT&CK 52 - Threat hunting with Microsoft Sentinel Explore creation and management of threat-hunting queries Save key findings with bookmarks Observe threats over time with livestream 53 - Use Search jobs in Microsoft Sentinel Hunt with a Search Job Restore historical data 54 - Hunt for threats using notebooks in Microsoft Sentinel Access Azure Sentinel data with external tools Hunt with notebooks Create a notebook Explore notebook code
Advanced Tableau
By Nexus Human
Duration 2.5 Days 15 CPD hours This course is intended for This course is intended for those with a basic understanding of Tableau who want to pursue mastery of the advanced features. Overview The goal of this course is to present essential Tableau concepts and its advanced functionalities to help better prepare and analyze data. This course will use Tableau Hyper, Tableau Prep and more. Getting Up to Speed ? a Review of the Basics Connecting Tableau to your data Connecting to Tableau Server Connecting to saved data sources Measure Names and Measure Values Three essential Tableau concepts Exporting data to other devices Summary All About Data ? Getting Your Data Ready Data mining and knowledge discovery process models CRISP?DM All About Data ? Joins, Blends, and Data Structures All About Data - Joins, Blends, and Data Structures Introduction to joins Introduction to complex joins Exercise: observing join culling Introduction to join calculations Introduction to spatial joins Introduction to unions Understanding data blending Order of operations No dimensions from a secondary source Introduction to scaffolding Introduction to data structures Exercise: adjusting the data structure for different questions Summary Table Calculations Table Calculations A definition and two questions Introduction to functions Directional and non-directional table calculations Application of functions Summary Level of Detail Calculations Level of Detail Calculations Building playgrounds Playground I: FIXED and EXCLUDE Playground II: INCLUDE Practical application Exercise: practical FIXED Exercise: practical INCLUDE Exercise: practical EXCLUDE Summary Beyond the Basic Chart Types Beyond the Basic Chart Types Improving popular visualizations Custom background images Tableau extensions Summary Mapping Mapping Extending Tableau's mapping capabilities without leaving Tableau Extending Tableau mapping with other technology Exercise: connecting to a WMS server Exploring the TMS file Exploring Mapbox Accessing different maps with a dashboard Creating custom polygons Converting shape files for Tableau Exercise: polygons for Texas Heatmaps Summary Tableau for Presentations Tableau for Presentations Getting the best images out of Tableau From Tableau to PowerPoint Embedding Tableau in PowerPoint Animating Tableau Story points and dashboards for Presentations Summary Visualization Best Practices and Dashboard Design Visualization Best Practices and Dashboard Design Visualization design theory Formatting rules Color rules Visualization type rules Compromises Keeping visualizations simple Dashboard design Dashboard layout Sheet selection Summary Advanced Analytics Advanced Analytics Self-service Analytics Use case ? Self-service Analytics Use case ? Geo-spatial Analytics Summary Improving Performance Improving Performance Understanding the performance-recording dashboard Exercise: exploring performance recording in Tableau desktop Performance-recording dashboard events Behind the scenes of the performance- recording dashboard Hardware and on-the-fly techniques Hardware considerations On-the-fly-techniques Single Data Source > Joining > Blending Three ways Tableau connects to data Using referential integrity when joining Advantages of blending Efficiently working with data sources Tuning data sources Working efficiently with large data sources Intelligent extracts Understanding the Tableau data extract Constructing an extract for optimal performance Exercise: summary aggregates for improved performance Optimizing extracts Exercise: materialized calculations Using filters wisely Extract filter performance Data source filter performance Context filters Dimension and measure filters Table-calculation filters Efficient calculations Boolean/Numbers > Date > String Additional performance considerations Avoid overcrowding a dashboard Fixing dashboard sizing Setting expectations Summary Additional course details: Nexus Humans Advanced Tableau training program is a workshop that presents an invigorating mix of sessions, lessons, and masterclasses meticulously crafted to propel your learning expedition forward. This immersive bootcamp-style experience boasts interactive lectures, hands-on labs, and collaborative hackathons, all strategically designed to fortify fundamental concepts. Guided by seasoned coaches, each session offers priceless insights and practical skills crucial for honing your expertise. Whether you're stepping into the realm of professional skills or a seasoned professional, this comprehensive course ensures you're equipped with the knowledge and prowess necessary for success. While we feel this is the best course for the Advanced Tableau course and one of our Top 10 we encourage you to read the course outline to make sure it is the right content for you. Additionally, private sessions, closed classes or dedicated events are available both live online and at our training centres in Dublin and London, as well as at your offices anywhere in the UK, Ireland or across EMEA.
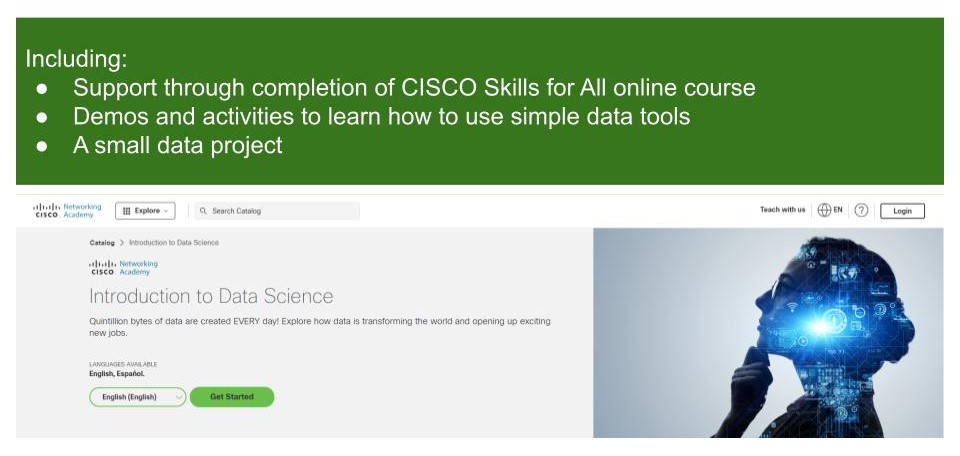
Introduction to Data Science
By futureCoders SE
Learn the basics of Data Science, combining a supported #CISCO Skills for All online course with practical learning and a project to help consolidate the learning.