- Professional Development
- Medicine & Nursing
- Arts & Crafts
- Health & Wellbeing
- Personal Development
385 Analyst courses in Lees delivered Live Online
Data visualization and infographics
By Fire Plus Algebra
The insights gained from data analysis are only truly valuable when you can be clearly expressed to other people – bosses, colleagues, clients, customers, or other stakeholders. In this workshop you’ll learn how to turn raw qualitative or quantitative data into a clear visual story through infographics and data visualization. We'll discuss the key principles for planning an effective visual, look at examples of best (and worst) practice, and learn repeatable and practical design techniques for enhancing the story. We'll also give you an overview of useful tools that will help you turn your idea into a finished infographic or data visualization. You could be conjuring up eye-catching slide decks, building effective reports and dashboards, pitching to investors, or presenting persuasive data to your most important customers. This is a fully interactive online workshop, so be prepared to join discussions and get hands on with building your own visualisations. Takeaways Be able to evaluate the elements that make an infographic or visualization effective. Learn quick and repeatable visual tricks for ensuring infographics convey a clear message. Understand how to tailor your approach to different audiences and context. Discover a bunch of free tools and resources to help you build your own visualizations. Understand how online, interactive visualizations work and how to create them. Delivery We deliver our courses over Zoom, to maximise flexibility. The training can be delivered in a single day, or across multiple sessions. All of our courses are live and interactive – every session includes a mix of formal tuition and hands-on exercises. To ensure this is possible, the number of attendees is capped at 16 people. Tutor Alan Rutter is the founder of Fire Plus Algebra. He is a specialist in communicating complex subjects through data visualisation, writing and design. He teaches for General Assembly and runs in-house training for public sector clients including the Home Office, the Department of Transport, the Biotechnology and Biological Sciences Research Council, the Health Foundation, and numerous local government and emergency services teams. He previously worked with Guardian Masterclasses on curating and delivering new course strands, including developing and teaching their B2B data visualisation courses. He oversaw the iPad edition launches of Wired, GQ, Vanity Fair and Vogue in the UK, and has worked with Condé Nast International as product owner on a bespoke digital asset management system for their 11 global markets. Testimonials "Just to say what a great course this was. I have made my first report employing some of the ideas and tools you showed us – to rapturous responses! The next actions are clear for all and they all understood it! Thank you for helping me to organise my data and thoughts, showing how to present the key message up front, and how to keep it simple and focused. Gearing up for another report now!" Kay Anderson | Head of Finance | Mima "We have been using Tableau to display data for some time but knew we could do more to engage our end users. Alan’s training gave us a framework to start thinking about what we wanted to achieve with our visualisations and analysis, and some great tips on how to display information for maximum impact. Alan was an engaging trainer and we found the workshops very energising." Ellen Austin | Senior Data Analyst | London School of Economics
Use Cases for Business Analysis: Virtual In-House Training
By IIL Europe Ltd
Use Cases for Business Analysis: Virtual In-House Training The use case is a method for documenting the interactions between the user of a system and the system itself. Use cases have been in the software development lexicon for over twenty years, ever since it was introduced by Ivar Jacobson in the late 1980s. They were originally intended as aids to software design in object-oriented approaches. However, the method is now used throughout the Solution Development Life Cycle from elicitation through to specifying test cases, and is even applied to software development that is not object oriented. This course identifies how business analysts can apply use cases to the processes of defining the problem domain through elicitation, analyzing the problem, defining the solution, and confirming the validity and usability of the solution. What you will Learn You'll learn how to: Apply the use case method to define the problem domain and discover the conditions that need improvement in a business process Employ use cases in the analysis of requirements and information to create a solution to the business problem Translate use cases into requirements Getting Started Introductions Course structure Course goals and objectives Foundation Concepts Overview of use case modeling What is a use case model? The 'how and why' of use cases When to perform use case modeling Where use cases fit into the solution life cycle Use cases in the problem domain Use cases in the solution domain Use case strengths and weaknesses Use case variations Use case driven development Use case lexicon Use cases Actors and roles Associations Goals Boundaries Use cases though the life cycle Use cases in the life cycle Managing requirements with use cases The life cycle is use case driven Elicitation with Use Cases Overview of the basic mechanics and vocabulary of use cases Apply methods of use case elicitation to define the problem domain, or 'as is' process Use case diagrams Why diagram? Partitioning the domain Use case diagramming guidelines How to employ use case diagrams in elicitation Guidelines for use case elicitation sessions Eliciting the problem domain Use case descriptions Use case generic description template Alternative templates Elements Pre and post conditions Main Success Scenario The conversation Alternate paths Exception paths Writing good use case descriptions Eliciting the detailed workflow with use case descriptions Additional information about use cases Analyzing Requirements with Use Cases Use case analysis on existing requirements Confirming and validating requirements with use cases Confirming and validating information with use cases Defining the actors and use cases in a set of requirements Creating the scenarios Essential (requirements) use case Use case level of detail Use Case Analysis Techniques Generalization and Specialization When to use generalization or specialization Generalization and specialization of actors Generalization and specialization of use cases Examples Associating generalizations Subtleties and guidelines Use Case Extensions The <> association The <> association Applying the extensions Incorporating extension points into use case descriptions Why use these extensions? Extensions or separate use cases Guidelines for extensions Applying use case extensions Patterns and anomalies o Redundant actors Linking hierarchies Granularity issues Non-user interface use cases Quality considerations Use case modeling errors to avoid Evaluating use case descriptions Use case quality checklist Relationship between Use Cases and Business Requirements Creating a Requirements Specification from Use Cases Flowing the conversation into requirements Mapping to functional specifications Adding non-functional requirements Relating use cases to other artifacts Wire diagrams and user interface specifications Tying use cases to test cases and scenarios Project plans and project schedules Relationship between Use Cases and Functional Specifications System use cases Reviewing business use cases Balancing use cases Use case realizations Expanding and explaining complexity Activity diagrams State Machine diagrams Sequence diagrams Activity Diagrams Applying what we know Extension points Use case chaining Identifying decision points Use Case Good Practices The documentation trail for use cases Use case re-use Use case checklist Summary What did we learn, and how can we implement this in our work environment?

Tableau Training On Tap - Fast Track
By Tableau Training Uk
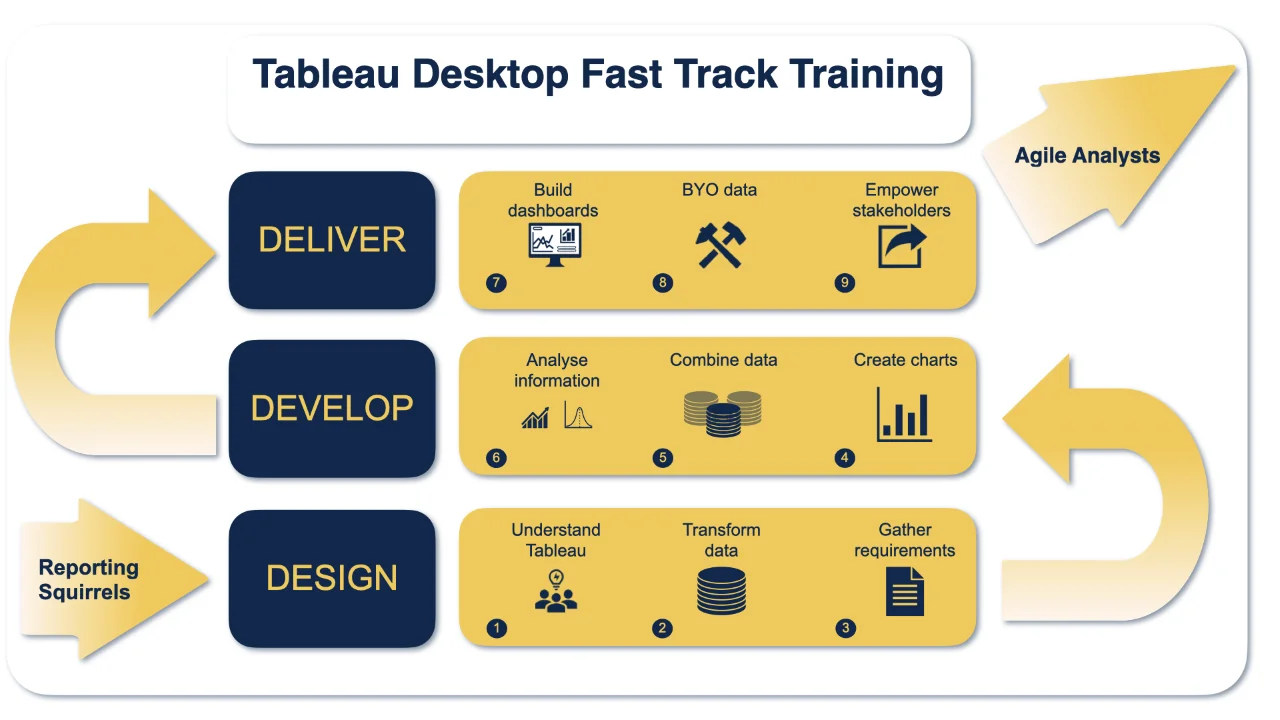
Tableau is an intuitive and simple tool to learn. This Tableau training course is a jumpstart to getting report writers and analysts who are self-taught or have no previous knowledge to being productive. It covers everything from connecting to data, through to creating interactive dashboards with a range of visualisations in three days. Having a quick turnaround from starting to use Tableau, to getting real, actionable insights means that you get a swift return on your investment. At the end of this course, you will be able to communicate insights more effectively, enabling your organisation to make better decisions, quickly. This accelerated approach is key to getting engagement from within your organisation so everyone can immediately see and feel the impact of the data and insights you create. Our Tableau Desktop Fast Track course combines all of our Foundation (Fundamentals) and Analyst (Intermediate) content into a 3 day live online course with added access to online bonus content of 3 additional modules. Gathering Requirements, Bring Your Own Data and Engaging Users. What do you get? This course is delivered live virtually and has all material provided through our online portal, together with email support and live coaching sessions. The full program includes all of the following elements: 3 days of live and interactive instructor-led sessions delivered by an expert Tableau Trainer 6 weeks access to our live coaching program delivered by expert Tableau coaches 50+ practical exercises to practice what you learn 12 months access to video’s that walk you through the theory and exercise solutions Practical advice, tools and resources for using Tableau in the real world The three additional online modules provide:Clarity on the approach to gathering dashboard requirements in a way that can be translated into dashboard designs.An agile and iterative development process that delivers products that meet user needs more quickly and effectively.An understanding of how end users will interact with dashboards to ensure that designers deliver actionable results. THE SYLLABUS PHASE 1: DESIGN MODULE 1: UNDERSTAND TABLEAU What is possible How does Tableau deal with data Know your way around Review of Type Conversions How do we format charts Dashboard basics – My first Dashboard MODULE 2: TRANSFORM DATA Connecting to and setting up data in Tableau Modifying data attributes How Do I Structure my Data – Groups & Hierarchies, Visual Groups How Tableau Deals with Dates – Using Discrete and Continuous Dates, Custom Dates How do I create calculated fields and why? – Creating Calculated Fields, Types of calculated fields, Row Level v Aggregations, Aggregating dimensions in calculations, Changing the Level of Detail (LOD) of calculations – What, Why, How MODULE 3: GATHER REQUIREMENTS(ONLINE CONTENT ONLY) Brainstorm and assess possible priorities Pitfalls to avoid Gather requirements PHASE 2: DEVELOP MODULE 4: CREATE CHARTS Charts that Compare Multiple Measures – Measure Names and Measure Values, Shared Axis Charts, Dual Axis Charts, Scatter Plots Showing progress over time Creating Tables – Creating Tables, Highlight Tables, Heat Maps Showing Relational & Proportional Data – Pie Charts, Donut Charts, Tree Maps Making things dynamic with parameters MODULE 5: COMBINE DATA Relationships Joining Tables – Join Types, Joining tables within the same database, cross database joins, join calculations Blending – How to create a blend with common fields, Custom defined Field relationships and mismatched element names, Calculated fields in blended data sources Unions – Manual Unions and mismatched columns, Wildcard unions Data Extracts – Creating & Editing Data extracts MODULE 6: ANALYSE INFORMATION Table Calculations Sets, Reference Lines, Trends and Forecasting Answering spatial questions – Mapping, Creating a choropleth (filled) map, Using your own images for spatial analysis, Mapping with spatial files Advanced charts Bar in Bar charts Bullet graphs Creating Bins and Histograms Creating a Box & Whisker plot Viz in Tooltips PHASE 3: DESIGN MODULE 7: BUILD DASHBOARDS Using the Dashboard Interface Device layouts Dashboard Actions – Set actions, Parameter actions Viz in Tooltips for Dashboards Dashboard containers – Horizontal & Vertical containers, Hidden containers Navigate between dashboards Telling data driven stories MODULE 8: BRING YOUR OWN DATA Design Best Practices & Resources Wireframe templates Questions Process Start building and testing MODULE 9: EMPOWER STAKEHOLDERS What is Tableau Server Publishing & permissions How can your users engage with content The Tableau ecosystem Review your progress Your next steps HOW MUCH OF YOUR TIME WILL THIS TAKE? Delegates are also provided 6 weeks access to our Tableau Coaching. We run Live Q&A sessions from 4pm-5pm on a Monday (Connecting to Data and Calculated Fields), 2pm-3pm Friday (Creating Charts) & 4pm-5pm Friday (Dashboard Design). The coaching helps delegates to transition from the theory of using Tableau to its practical use. We’d be expecting them to apply the exercises you’ll be doing during the course, onto your own data after the course. In our experience, this is the best way to increase both understanding and long term memory retention. The live coaching also acts as a troubleshooting platform for any practical issues that delegates need to overcome in the real world. Delegates also have 12 months access to all of the training material covered in the course in the form of an online portal (this includes theory videos, exercise solution videos, exercise materials and even quizzes). We have a growing LinkedIn community that delegates are encouraged to join and participate in. We regularly post useful blog posts and additional training that will enhance the Tableau journey and understanding. We help teams using Tableau to transform in the following ways : From a disjointed understanding of Tableau – To being familiar with Tableau terminology and capability From ad-hoc data uploads and error prone calculations – To reusable data connections and robust metrics From disjointed stakeholder questions – To clear and concise requirements that lead to decision making From being unsure how difficult Tableau will be to learn – To being able to develop standard charts and tables in Tableau with dynamic reporting capabilities From manually combining data for each analytical task – To dynamically combining data from multiple tables for analysis From being unsure how to answer analytical questions and what options there are – To being equipped with multiple actionable, dynamic, analytical use cases From not knowing Why, When and How to create Dashboards or Story’s – To being able to combine analysis to answer complex questions and tell data driven stories From using demo data theory – To Delivering value [Answering questions] on their own data From spending lots of time answering colleagues ad-hoc (data) questions – To empowering stakeholders in answering ad-hoc queries and reducing the time to analyse and steer the business
EC-Council Certified Network Defender (C|ND) v.2
By Nexus Human
Duration 5 Days 30 CPD hours This course is intended for Network Administrators Network security Administrators Network Security Engineer Network Defense Technicians CND Analyst Security Analyst Security Operator Anyone who involves in network operations Overview A dedicated focus on IoT security Network virtualization practices for the remote workforce Enhanced Cloud Security & IoT and Operational Technology (OT) Modules Introduction to threat intelligence In-depth Attack Surface Analysis Certified Network Defender (CND) is a vendor-neutral, hands-on, instructor-led comprehensive network security certification training program. It is a skills-based, lab intensive program based on the security education framework and work role task analysis presented by the National Infocomm Competency Framework (NICF) as well as a job-task analysis and cybersecurity education framework by the National Initiative of Cybersecurity Education (NICE). The course has also been mapped to global job roles and to the Department of Defense (DoD) job roles for system/network administrators. The program prepares network administrators how to identify what parts of an organization need to be reviewed and tested for security vulnerabilities and how to reduce, prevent, and mitigate risks in the network. CND covers the protect, detect, respond and predict approach to network security. Course Outline Network Attacks and Defense Strategies Administrative Network Security Technical Network Security Network Perimeter Security Endpoint Security-Windows Systems Endpoint Security-Linux Systems Endpoint Security- Mobile Devices Endpoint Security-IoT Devices Administrative Application Security Data Security Enterprise Virtual Network Security Enterprise Cloud Network Security Enterprise Wireless Network Security Network Traffic Monitoring and Analysis Network Logs Monitoring and Analysis Incident Response and Forensic Investigation Business Continuity and Disaster Recovery Risk Anticipation with Risk Management Threat Assessment with Attack Surface Analysis Threat Prediction with Cyber Threat Intelligence

LEAN SIX SIGMA GREEN BELT
By EduHubInstitute
We offer the most advanced “Certified Six Sigma Green Belt Course” as per the curriculum outline of The ASQ Body of Knowledge and accredited by top international Lean & Six Sigma accreditation bodies. Six Sigma Green Belt Deliverables: 22+ hours of Instructor-led interactive virtual classroom session on the weekend Access to 45+ hours of Module based Six Sigma lectures via LMS 100+ Toolkits and Project Templates for Analysis and Implementation Soft copy of Lean Six Sigma Green Belt Body of Knowledge Live Data-oriented project, with Scenario and Analysis Methodology 20+ Dummy Projects and Case studies for Lean Six Sigma Application Support via subject expert through telephonic discussion on the weekend Sample Questions and Examination Guide for Certification Preparation Pre and Post assignments for process groups and knowledge areas Project implementation support and Data visualization using MINITAB PRO CLSSGB certification examination anytime within the 90 days course duration Certification Validation Tool for third-party credentials validation PARTICULARS Duration (Hours) 1. Define Phase 22 2. Measure Phase 14 3. Analyse Phase 20 4. Improve Phase 7 5. Control Phase 7 Total Duration 70 (Hours) Introduction Become an expert in six sigma methodology by getting hands-on knowledge on DMAIC, Project Charter, Process Capability, FMEA, Sigma calculation, Test of Hypothesis, Control Charts, VSM, JIT using real case scenarios and real-life examples. Lean and DMAIC methodologies using live projects. The Six Sigma Certification is accredited by The Council for Six Sigma Certification. The certification also acknowledges the BOK outline of The American Society for Quality, USA. The course features world-class content with live projects and MINITAB PRO driven data analysis training with end to end support in project implementation by Master Black Belt Experts and Trainers. What is Six Sigma Certification? A person with Six Sigma certification has problem-solving abilities. Someone may gain Green Belt, Black Belt or Master Black Belt certification. The higher certification one attains, the more is the ability to solve complex organizational problems. Six Sigma certification is a process of individual’s knowledge validation using a classification system, generally referred to as "Belts" (Green Belt, Black Belt, Master Black Belt) This verification test individual commands over six sigma methodology and tools. The belt classification shows the position these certified individuals would occupy in an organizational structure and job roles. Six Sigma Green Belt training is especially for the future project leaders of Lean Six Sigma projects. We deliberately mix non-profit with profit participants. There will then be fun, useful discussions and knowledge exchanges during the training sessions. In addition, there are also many self-employed people who follow the LSS Green Belt training to increase their expertise as in a trimmer. What do you do to get the Six Sigma Green Belt certificate? Our Six Sigma Green Belt training consists of a number of components: Training: in an intensive training program you learn the background of Lean and Six Sigma and we put what we have learned into practice with different simulations. Extra: With our Body of Knowledge and whitepapers you place what you have learned in a theoretical framework. The program also contains various homework assignments, in which we focus, among other things, on the use of MINITAB PRO. Follow-up: During the training, you will receive an access code to an e-learning module. You can pass the substance again in an interactive way. Exam: On the last training day you will make the CLSSGB Green Belt exam. If you succeed, you will immediately receive the official Certified Lean Six Sigma Green Belt certification. Global Recognition of Your Certification: Agenda Overview of Six Sigma and the organizationSix Sigma and organizational goalsValue of six sigmaOrganizational goals and six sigma projectsOrganizational drivers and metricsLean principles in the organizationLean conceptsValue-streaming mappingDesign for six sigma (DFSS) methodologiesRoadmaps for DFSSBasic failure mode and effects analysis (FMEA)Design FMEA and process FMEA Define PhaseProject identificationProject SelectionProcess elementsBenchmarkingProcess inputs and outputsOwners and stakeholders Voice of the customer (VOC) Customer identificationCustomer dataCustomer requirements Project Management Basics Project charterProject scopeProject metricsProject planning toolsProject documentationProject risk analysisProject closureManagement and planning toolsBusiness results for projectsProcess performance CommunicationTeam dynamics and performanceTeam stages and dynamicsTeam roles and responsibilitiesTeam toolsTeam Communication Measure PhaseProcess analysis and documentationProbability and statisticsBasic probability conceptsCentral limit theorem, Statistical distributions, Collecting and summarizing dataTypes of data and measurement scalesSampling and data collection methodsDescriptive statisticsGraphical methodsMeasure Phase (contd E. Measurement system analysis (MSA) F. Process and performance capabilityProcess performance vs. process specificationsProcess capability studiesProcess capability (Cp, Cpk) and process performance (Pp, Ppk) indicesShort-term vs. long-term capability and sigma shift Analyze PhaseExploratory data analysisMulti-vari studiesCorrelation and linear regression B, Hypothesis testingBasics Tests for means, variances, and proportionsIntroduction to MINITAB Data analysis Improve Phase of Six SigmaDesign of experiments (DOE)Basic terms, DOE graphs, and plotsThe root cause analysisLean Tools 1. Waste elimination 2. Cycle-time reduction 3. Kaizen and kaizen blitz V1. Control PhaseStatistical process control (SPC)SPC BasicsRational subgroupingControl chartsControl planLean tools for process controlTotal productive maintenance (TPM)Visual factory Project Implementation & SupportMINITAB Practice and guidance for projectProject implementation supportTemplates and Toolkits application for Project workSupport on Data Project, Implementation and project completion BenefitsFrom the course Learn the principles and philosophy behind the Six Sigma technique Learn to apply statistical methods to improve business processes Design and implement Six Sigma projects in a practical scenario Learn the DMAIC process and various tools used in Six Sigma methodology Knowledge of Six Sigma Green Belt Professional enables you to understand real-world business problems, increase an organization's revenue by streamlining the process, and become an asset to an organization According to Villanova University, employers such as United Health Group, Honeywell, GE and Volkswagen have been actively seeking professionals with Six Sigma to fill a variety of positions The Training enhances your skills and enables you to perform roles like Quality Manager, Quality Analyst, Finance Manager, Supervisor, Quality Control, etc. According to Indeed.com, the national average salary for a Six Sigma Green Belt is $72,000 per year in the United States. From the workshop Instructor LED training by Six Sigma Black Belt and Master Belt experts to make candidate learn the real scenario of six sigma tools and methodology Learn the principles and philosophy behind the Six Sigma method Dummy project by instructors to make candidate get a hands-on six sigma projects Downloadable Six Sigma PPT & Six Sigma PDF Industry Based case studies High-Quality training from an experienced trainer The Program extensively uses Minitab, specialized statistical software. It provides you with a thorough knowledge of Six Sigma philosophies and principles (including supporting systems and tools). Know about six sigma certification cost and six sigma green belt certification cost. Who should attend? The Six Sigma program is designed for professionals and students who want to develop the ability to lead process improvement initiatives. Six Sigma tools and process is widely used in all business processes. Six Sigma is applicable in all industry and in all functional areas. An indicative list of participants in our Green Belt program could include: Financial/business analyst Commodity manager Project manager Quality manager Production manager Production Engineer Business development manager Manufacturing process engineer Continuous improvement director Business managers or consultants Project manager/Program Manager Director or VP of operations CEO, CFO, CTO Certification On successful completion of the course and course requisites, the candidate will receive Internationally recognized Six Sigma Green Belt Certification. This course offers Six Sigma Certification Validation Tool for Employers Your Six Sigma Certification Validation Tool can be used by employers, clients and other stakeholders to validate the authenticity of your Six Sigma Certifications you have received. Using the programming code located on your certified LSSGB certification, one can see all your training and certification details online.

55232 Writing Analytical Queries for Business Intelligence
By Nexus Human
Duration 3 Days 18 CPD hours This course is intended for This course is intended for information workers and data science professionals who seek to use database reporting and analysis tools such as Microsoft SQL Server Reporting Services, Excel, Power BI, R, SAS and other business intelligence tools, and wish to use TSQL queries to efficiently retrieve data sets from Microsoft SQL Server relational databases for use with these tools. Overview After completing this course, students will be able to: - Identify independent and dependent variables and measurement levels in their own analytical work scenarios. - Identify variables of interest in relational database tables. - Choose a data aggregation level and data set design appropriate for the intended analysis and tool. - Use TSQL SELECT queries to produce ready-to-use data sets for analysis in tools such as PowerBI, SQL Server Reporting Services, Excel, R, SAS, SPSS, and others. - Create stored procedures, views, and functions to modularize data retrieval code. This course is about writing TSQL queries for the purpose of database reporting, analysis, and business intelligence. 1 - INTRODUCTION TO TSQL FOR BUSINESS INTELLIGENCE Two Approaches to SQL Programming TSQL Data Retrieval in an Analytics / Business Intelligence Environment The Database Engine SQL Server Management Studio and the CarDeal Sample Database Identifying Variables in Tables SQL is a Declarative Language Introduction to the SELECT Query Lab 1: Introduction to TSQL for Business Intelligence 2 - TURNING TABLE COLUMNS INTO VARIABLES FOR ANALYSIS: SELECT LIST EXPRESSIONS, WHERE, AND ORDER BY Turning Columns into Variables for Analysis Column Expressions, Data Types, and Built-in Functions Column aliases Data type conversions Built-in Scalar Functions Table Aliases The WHERE clause ORDER BY Lab 1: Write queries 3 - COMBINING COLUMNS FROM MULTIPLE TABLES INTO A SINGLE DATASET: THE JOIN OPERATORS Primary Keys, Foreign Keys, and Joins Understanding Joins, Part 1: CROSS JOIN and the Full Cartesian Product Understanding Joins, Part 2: The INNER JOIN Understanding Joins, Part 3: The OUTER JOINS Understanding Joins, Part 4: Joining more than two tables Understanding Joins, Part 5: Combining INNER and OUTER JOINs Combining JOIN Operations with WHERE and ORDER BY Lab 1: Write SELECT queries 4 - CREATING AN APPROPRIATE AGGREGATION LEVEL USING GROUP BY Identifying required aggregation level and granularity Aggregate Functions GROUP BY HAVING Order of operations in SELECT queries Lab 1: Write queries 5 - SUBQUERIES, DERIVED TABLES AND COMMON TABLE EXPRESSIONS Non-correlated and correlated subqueries Derived tables Common table expressions Lab 1: Write queries 6 - ENCAPSULATING DATA RETRIEVAL LOGIC Views Table-valued functions Stored procedures Creating objects for read-access users Creating database accounts for analytical client tools Lab 1: Encapsulating Data Retrieval Logic 7 - GETTING YOUR DATASET TO THE CLIENT Connecting to SQL Server and Submitting Queries from Client Tools Connecting and running SELECT queries from: Excel PowerBI RStudio Exporting datasets to files using Results pane from SSMS The bcp utility The Import/Export Wizard Lab 1: Getting Your Dataset to the Client Additional course details: Nexus Humans 55232 Writing Analytical Queries for Business Intelligence training program is a workshop that presents an invigorating mix of sessions, lessons, and masterclasses meticulously crafted to propel your learning expedition forward. This immersive bootcamp-style experience boasts interactive lectures, hands-on labs, and collaborative hackathons, all strategically designed to fortify fundamental concepts. Guided by seasoned coaches, each session offers priceless insights and practical skills crucial for honing your expertise. Whether you're stepping into the realm of professional skills or a seasoned professional, this comprehensive course ensures you're equipped with the knowledge and prowess necessary for success. While we feel this is the best course for the 55232 Writing Analytical Queries for Business Intelligence course and one of our Top 10 we encourage you to read the course outline to make sure it is the right content for you. Additionally, private sessions, closed classes or dedicated events are available both live online and at our training centres in Dublin and London, as well as at your offices anywhere in the UK, Ireland or across EMEA.
Palo Alto Networks : Cortex XSOAR 6.8: Automation and Orchestration (EDU-380)
By Nexus Human
Duration 5 Days 30 CPD hours This course is intended for Security-operations (SecOps), or security, orchestration, automation, and response (SOAR) engineers, managed security service providers (MSSPs), service delivery partners, system integrators, and professional services engineers Overview This training is designed to enable a SOC, CERT, CSIRT, or SOAR engineer to start working with Cortex XSOAR integrations, playbooks, incident-page layouts, and other system features to facilitate resource orchestration, process automation, case management, and analyst workflow.The course includes coverage of a complete playbook-development process for automating a typical analyst workflow to address phishing incidents. This end-to-end view of the development process provides a framework for more focused discussions of individual topics that are covered in the course. The Cortex? XSOAR 6.2: Automation and Orchestration (EDU-380) course is four days of instructor-led training that will help you: Configure integrations, create tasks, and develop playbooks.Build incident layouts that enable analysts to triage and investigate incidents efficientlyIdentify how to categorize event information and map that information to display fields.Develop automations, manage content, indicator data, and artifact stores, schedule jobs, organize users and user roles, oversee case management, and foster collaboration Course Outline 1 - Core functionality and Feature Sets 2 - Enabling and Configuring Integrations 3 - Playbook Development 4 - Classification and Mapping 5 - Layout Builder 6 - Solution Architecture - Docker 8 - Automation Development & Debugging 9 - Content Management 10 - Indicators 11 - Jobs and Job Scheduling 12 - Users and Role Management 13 - Integration Development Additional course details: Nexus Humans Palo Alto Networks : Cortex XSOAR 6.8: Automation and Orchestration (EDU-380) training program is a workshop that presents an invigorating mix of sessions, lessons, and masterclasses meticulously crafted to propel your learning expedition forward. This immersive bootcamp-style experience boasts interactive lectures, hands-on labs, and collaborative hackathons, all strategically designed to fortify fundamental concepts. Guided by seasoned coaches, each session offers priceless insights and practical skills crucial for honing your expertise. Whether you're stepping into the realm of professional skills or a seasoned professional, this comprehensive course ensures you're equipped with the knowledge and prowess necessary for success. While we feel this is the best course for the Palo Alto Networks : Cortex XSOAR 6.8: Automation and Orchestration (EDU-380) course and one of our Top 10 we encourage you to read the course outline to make sure it is the right content for you. Additionally, private sessions, closed classes or dedicated events are available both live online and at our training centres in Dublin and London, as well as at your offices anywhere in the UK, Ireland or across EMEA.
BOHS P400 - Asbestos Foundation Module Online
By Airborne Environmental Consultants Ltd
P400 - Asbestos Surveying and Analysis is a one day foundation level course, which provides candidates with the fundamental knowledge to start a career in the asbestos surveying and analysis professions, and as a progression route to the asbestos Proficiency qualifications. It gives candidates an introductory level of knowledge on the health risks of asbestos fibres, and how to manage asbestos-containing materials in their work. Candidates for this course are not expected to have prior knowledge and experience but having an awareness of the contents of both HSG248 Asbestos: The analysts' guide (July 2021) and HSG264 Asbestos: the survey guide January 2010), would be advantageous.

RSPH - Level 3 Award in Asbestos Air Monitoring and Clearance Procedures
By Airborne Environmental Consultants Ltd
This course provides the theory, practical knowledge and skills required for use of microscopes and fibre counting to WHO rules, air sampling and four-stage clearance procedures. The course is based around 'HSG248 Asbestos: The Analysts Guide for Sampling, Analysis and Clearance Procedures'.