- Professional Development
- Medicine & Nursing
- Arts & Crafts
- Health & Wellbeing
- Personal Development
396 Courses
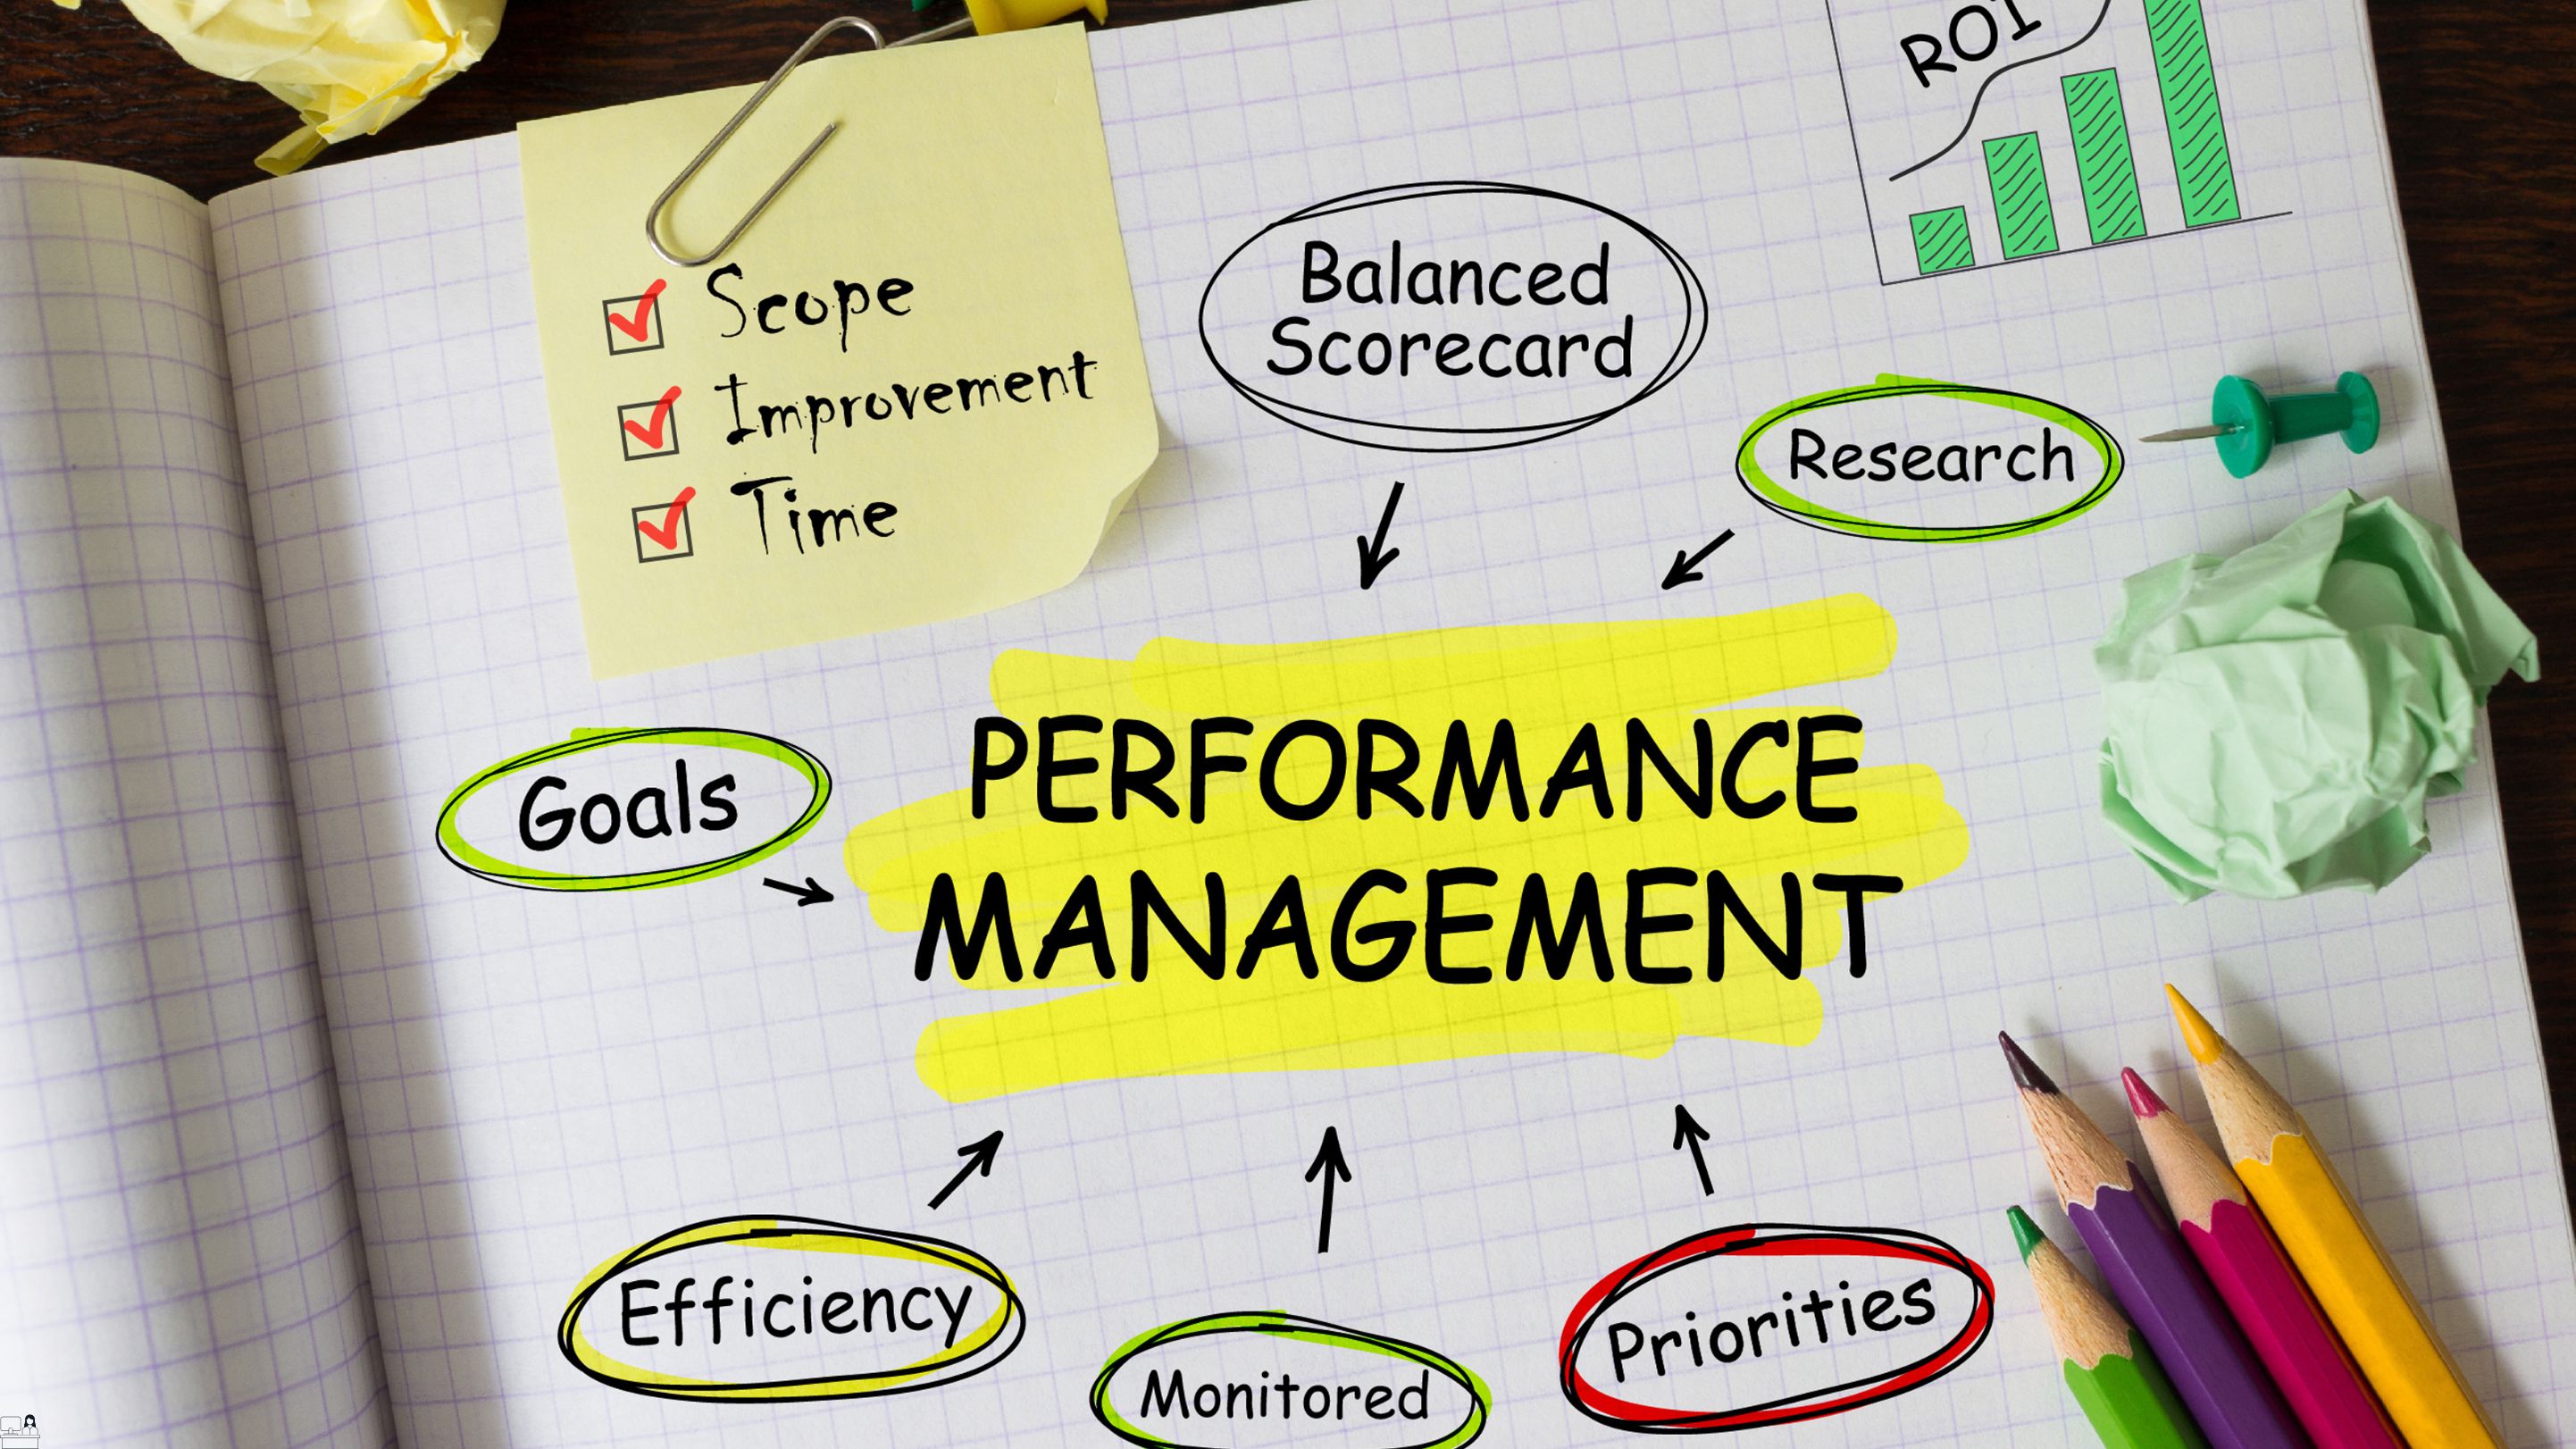
Performance Management Training
By Compete High
ð Unlock Your Potential with Performance Management Training! ð Are you ready to elevate your career to new heights? Look no further than our dynamic Performance Management Training course! Designed to empower professionals like you with the essential skills and knowledge to excel in today's competitive landscape, this comprehensive program is your gateway to success. Why Performance Management Training? In today's fast-paced business world, effective performance management is more crucial than ever before. ð Organizations worldwide are constantly seeking skilled individuals who can drive performance, motivate teams, and achieve strategic objectives. By enrolling in our Performance Management Training course, you'll gain invaluable insights and techniques to optimize individual and team performance, ultimately propelling your career forward. Benefits of Our Course: ð Enhanced Performance: Learn how to set clear goals, provide constructive feedback, and conduct impactful performance evaluations to inspire your team to reach new heights. ð¼ Strategic Alignment: Discover how to align individual goals with organizational objectives, ensuring everyone is working towards a common purpose. ð Effective Communication: Master the art of communication and interpersonal skills to foster a positive and productive work environment. ð Data-Driven Decisions: Harness the power of data analytics to measure performance, identify areas for improvement, and make informed decisions that drive success. ð¡ Continuous Improvement: Adopt a growth mindset and implement strategies for continuous improvement, both personally and within your team. Who is this for? Our Performance Management Training course is ideal for professionals at all levels who are eager to enhance their leadership skills and drive meaningful results. Whether you're a seasoned manager looking to refine your approach or an aspiring leader seeking to build a strong foundation, this course is tailored to meet your needs. HR professionals, team leaders, project managers, and executives alike will benefit from the practical strategies and techniques taught in this program. Career Path By mastering the principles of performance management, you'll unlock a world of opportunities across various industries and sectors. Whether you aspire to climb the corporate ladder, transition into a leadership role, or launch your own entrepreneurial venture, the skills acquired in this course will set you apart from the competition. From managerial positions to executive leadership roles, the ability to drive performance and maximize productivity is highly sought after by employers worldwide. In Conclusion Don't let the opportunity to supercharge your career pass you by! Enroll in our Performance Management Training course today and embark on a journey towards professional excellence. With expert instruction, practical insights, and a supportive learning environment, you'll be well-equipped to tackle any challenge that comes your way. Invest in yourself and reap the rewards of a successful career in performance management. The future belongs to those who dare to pursue greatness - join us and unleash your full potential! ð FAQ (Frequently Asked Questions) 1. Is this course suitable for beginners? Absolutely! Our Performance Management Training course is designed to cater to individuals at all skill levels, from beginners to seasoned professionals. Whether you're just starting your career journey or looking to enhance your existing knowledge, our comprehensive curriculum provides the perfect foundation for success. 2. How long does the course take to complete? The duration of the course may vary depending on the learning format and individual pace. Typically, our program is structured to be completed within a set timeframe, ranging from a few weeks to several months. However, we understand that everyone's schedule is unique, so we offer flexible options to accommodate your needs. 3. What learning materials are included? When you enroll in our Performance Management Training course, you'll gain access to a wealth of resources designed to enhance your learning experience. From interactive modules and video lectures to case studies and practical exercises, our comprehensive curriculum covers all aspects of performance management to ensure you have the tools you need to succeed. 4. Will I receive a certificate upon completion? Yes! Upon successfully completing the course requirements, you'll receive a certificate of completion to showcase your newfound skills and expertise in performance management. This certificate can be a valuable addition to your resume and demonstrate your commitment to professional development to potential employers. 5. Can I interact with instructors and fellow students? Absolutely! We believe in the power of collaboration and interaction in the learning process. Throughout the course, you'll have the opportunity to engage with instructors and fellow students through discussion forums, live Q&A sessions, and group projects. This collaborative environment fosters a sense of community and allows for meaningful exchange of ideas and insights. 6. How will this course benefit my career? Our Performance Management Training course equips you with the essential skills and knowledge needed to excel in today's competitive job market. Whether you're looking to advance in your current role, transition into a new position, or explore entrepreneurial opportunities, the principles and techniques you learn in this course will set you apart from the competition and open doors to exciting career prospects. 7. Can I access course materials after completion? Yes! We believe in lifelong learning and want to support your ongoing professional development. Upon completing the course, you'll retain access to course materials and resources, allowing you to review key concepts, refresh your skills, and stay up-to-date with the latest trends and best practices in performance management. Still have questions? Feel free to reach out to our dedicated support team for assistance. We're here to help you succeed every step of the way! Course Curriculum Module 1_ Introduction to Performance Management. Introduction to Performance Management. 00:00 Module 2_ Setting Performance Goals. Setting Performance Goals. 00:00 Module 3_ Providing Feedback. Providing Feedback. 00:00 Module 4_ Evaluating Progress. Evaluating Progress. 00:00 Module 5_ Managing Virtual Teams. Managing Virtual Teams. 00:00
Microsoft Excel Crash Course 2024: Masterclass for Weekend
By Compete High
ð Unlock Your Excel Potential with the Microsoft Excel Crash Course 2024: Masterclass for Weekend! ð Are you tired of spending endless hours trying to figure out Microsoft Excel on your own? Do you want to boost your skills and become an Excel pro without sacrificing your entire weekend? Look no further - our Microsoft Excel Crash Course 2024 is here to revolutionize the way you work with spreadsheets! ð¥ Why Excel Matters: In today's data-driven world, Excel proficiency is a non-negotiable skill. Whether you're a student, a professional, or someone looking to enhance your productivity, mastering Excel can open doors to new opportunities. ð¡ What Sets Our Masterclass Apart: â Weekend-Friendly Format: We get it - your time is precious! That's why our course is designed to be completed over a weekend, giving you the skills you need without disrupting your busy schedule. â Hands-On Learning: Forget boring lectures! Dive straight into hands-on, practical exercises that reinforce your learning. Our step-by-step approach ensures you grasp each concept thoroughly. â Up-to-Date Content: Excel evolves, and so do we! Our 2024 edition is packed with the latest features and best practices, ensuring you're on the cutting edge of spreadsheet mastery. â Expert Guidance: Learn from seasoned Excel experts who've cracked the code to efficient and effective spreadsheet use. Benefit from their real-world insights and insider tips that go beyond basic functions. â Lifetime Access: Purchase once, benefit forever! Gain access to our course materials, updates, and a supportive community, ensuring you stay on top of your Excel game for years to come. ð Course Highlights: ð Essential Excel Functions: From basic formulas to advanced functions, we cover it all. ð Data Visualization: Transform your data into impactful charts and graphs. ð Pivot Tables Mastery: Unlock the power of data analysis with Pivot Tables. ð Time-Saving Shortcuts: Work smarter, not harder, with keyboard shortcuts. ð Advanced Formulas: Impress your colleagues with advanced calculations. ð Automation with Macros: Streamline your tasks with Excel automation. ð Error Handling: Learn how to troubleshoot and avoid common mistakes. ð Who Should Enroll: Professionals looking to enhance their spreadsheet skills. Students aiming to boost their academic performance. Entrepreneurs and business owners seeking data-driven insights. Anyone wanting to save time and increase productivity. ð Get Ready to Excel! Don't miss out on this opportunity to become an Excel maestro in just one weekend! Enroll now in the Microsoft Excel Crash Course 2024: Masterclass for Weekend and empower yourself with the skills that will set you apart. ð Limited seats available. Secure your spot now! ð Disclaimer: Results may vary based on individual commitment and practice. Course Curriculum Module- 1 Introduction 00:00 Getting started on Windows, macOS, Android, and IOS 00:00 How to ask great questions 00:00 FAQ 00:00 Start Excel 00:00 Module- 2 Overview of top Excel tips 00:00 Add numbers like a pro 00:00 Save time by filling cells automatically 00:00 Did data enter into one column - Split it 00:00 Switch data around by transposing it 00:00 Sort and filter for quick results 00:00 Create a data table for tasks to make it easy 00:00 Make drop-down list 00:00 Quick Data Analysis 00:00 Great charts for your visualization 00:00 Pivot Tables for Data Analytics 00:00 Module- 3 Introduction 00:00 Basic formula operations 00:00 Mathematical functions level1 00:00 Mathematical functions level2 00:00 Text functions level1 00:00 Text functions level2 00:00 Logical functions 00:00 Date time functions 00:00 V Lookup formula 00:00 HLookup formula 00:00 HLookup Match formula 00:00 Match Index formula 00:00 Module- 4 Introduction 00:00 XLookup 00:00 Handling NA and Approximates match in XLookup 00:00 Wildcard matching in XLookup 00:00 Module- 5 Introduction 00:00 Split Text into columns 00:00 Flash Fill 00:00 Remove Duplicates 00:00 Data Validation 00:00 Get - import Data from Text 00:00 Get - import Data from CSV 00:00 Module- 6 Introduction 00:00 Creating Pivot Table 00:00 Value field settings 00:00 Number format 00:00 Pivot Table Design 00:00 Excel Exercise 00:00 Solution for Excel Exercise 00:00 Module- 7 Introduction 00:00 Excel Charts - Categories 00:00 Elements of a chart 00:00 Easy way to create charts 00:00 Column or Bar charts 00:00 Formatting charts 00:00 Line charts 00:00 Area charts 00:00 Pie and Doughnut charts 00:00 Format Area Plot or XY chart 00:00 Scatter or bubble charts 00:00

Learn to Drive Traffic into Sales through Digital Marketing
By NextGen Learning
Learn to Drive Traffic into Sales through Digital Marketing Course Overview This course on "Learn to Drive Traffic into Sales through Digital Marketing" provides learners with the essential skills to effectively use digital marketing strategies to attract, engage, and convert online traffic into sales. Covering key areas such as SEO, social media marketing, content creation, and email marketing, the course equips learners with the knowledge to optimise digital campaigns and enhance business visibility. The course is designed for individuals seeking to master digital marketing techniques to increase online sales and drive business growth. By the end of the course, learners will have a comprehensive understanding of traffic generation strategies and how to convert them into tangible business results. Course Description In this course, learners will explore various digital marketing techniques aimed at driving traffic to websites and converting that traffic into sales. Topics include SEO fundamentals, social media marketing strategies, email marketing campaigns, and creating compelling content. The course provides a structured approach to understanding how to leverage these strategies effectively, using data analytics to track and improve performance. Learners will gain the ability to create digital marketing plans, monitor campaign success, and optimise strategies to enhance online sales. The course is designed for those who want to advance their digital marketing skills and improve conversion rates, whether for personal projects or within their professional roles. Learn to Drive Traffic into Sales through Digital Marketing Curriculum Module 01: Introduction to Digital Marketing Module 02: SEO Strategies for Traffic Growth Module 03: Social Media Marketing for Engagement Module 04: Email Marketing to Convert Leads Module 05: Creating Content that Converts Module 06: Analytics and Campaign Optimisation (See full curriculum) Who is this course for? Individuals seeking to increase their online sales through digital marketing. Professionals aiming to enhance their digital marketing knowledge and career prospects. Beginners with an interest in driving business growth via online channels. Entrepreneurs wanting to optimise their digital marketing efforts. Career Path Digital Marketing Specialist SEO Manager Social Media Manager Content Marketing Strategist Email Marketing Coordinator E-commerce Manager

Develop Big Data Pipelines with R, Sparklyr & Power BI
By NextGen Learning
Develop Big Data Pipelines with R, Sparklyr & Power BI Course Overview: This course offers a comprehensive exploration of building and managing big data pipelines using R, Sparklyr, and Power BI. Learners will gain valuable insight into the entire process, from setting up and installing the necessary tools to creating effective ETL pipelines, implementing machine learning techniques, and visualising data with Power BI. The course is designed to provide a strong foundation in data engineering, enabling learners to handle large datasets, optimise data workflows, and communicate insights clearly using visual tools. By the end of this course, learners will have the expertise to work with big data, manage ETL pipelines, and use Sparklyr and Power BI to drive data-driven decisions in various professional settings. Course Description: This course delves into the core concepts and techniques for managing big data using R, Sparklyr, and Power BI. It covers a range of topics including the setup and installation of necessary tools, building ETL pipelines with Sparklyr, applying machine learning models to big data, and using Power BI for creating powerful visualisations. Learners will explore how to extract, transform, and load large datasets, and will develop a strong understanding of big data architecture. They will also gain proficiency in visualising complex data and presenting findings effectively. The course is structured to enhance learners' problem-solving abilities and their competence in big data environments, equipping them with the skills needed to manage and interpret vast amounts of information. Develop Big Data Pipelines with R, Sparklyr & Power BI Curriculum: Module 01: Introduction Module 02: Setup and Installations Module 03: Building the Big Data ETL Pipeline with Sparklyr Module 04: Big Data Machine Learning with Sparklyr Module 05: Data Visualisation with Power BI (See full curriculum) Who is this course for? Individuals seeking to understand big data pipelines. Professionals aiming to expand their data engineering skills. Beginners with an interest in data analytics and big data tools. Anyone looking to enhance their ability to analyse and visualise data. Career Path: Data Engineer Data Analyst Data Scientist Business Intelligence Analyst Machine Learning Engineer Big Data Consultant

Microsoft Power BI Training
By NextGen Learning
Microsoft Power BI Training Course Overview: The Microsoft Power BI Training course is designed to equip learners with the knowledge and skills to use Power BI effectively for data analysis and reporting. This course covers the core features of Power BI, from data import and transformation to the creation of reports and visualizations. Learners will explore how to analyse data, generate insights, and create dynamic dashboards for reporting purposes. Whether you are looking to improve your analytical skills or advance your career, this course provides the foundation needed to become proficient in using Power BI for various data analysis tasks. By the end of the course, learners will be able to handle large data sets, create compelling visual reports, and make data-driven decisions. Course Description: This comprehensive Microsoft Power BI course delves into the essential components of the Power BI platform. Learners will start by exploring how to import and work with data, before progressing to designing reports and visualizations. The course includes an in-depth look at the various types of visualizations available, enabling learners to display data in an intuitive, easy-to-understand format. Additionally, learners will explore the Power BI Web App to access and share their reports online. As they move through the course, participants will gain valuable skills in data transformation, reporting, and visualization, all of which are applicable to industries requiring data-driven decision-making. By completing this course, learners will have a solid understanding of Power BI and the ability to create impactful reports and dashboards for business or personal use. Microsoft Power BI Training Curriculum: Module 01: Getting Started Module 02: Working with Data Module 03: Working with Reports and Visualizations Module 04: A Closer Look at Visualizations Module 05: Introduction to the Power BI Web App (See full curriculum) Who is this course for? Individuals seeking to understand Power BI and data analysis. Professionals aiming to enhance their data reporting skills. Beginners with an interest in business intelligence and data analytics. Anyone looking to improve their ability to visualise data for better decision-making. Career Path: Data Analyst Business Intelligence Analyst Reporting Specialist Data Visualisation Specialist Business Analyst

Ecommerce Management
By IOMH - Institute of Mental Health
Overview of Ecommerce Management Imagine a world where your business never sleeps, reaching customers across the globe 24/7. Welcome to the realm of ecommerce management, where digital shopfronts are the new high streets. The UK's e-commerce market is booming, expected to reach £500 billion by 2024. Our ecommerce management course is your ticket to riding this digital wave. From crafting winning strategies to mastering customer service, from building strong brands to creating captivating content, this ecommerce management course covers it all. Dive into the intricacies of social media marketing, learn to create user experiences that convert browsers into buyers, and harness the power of data analytics to drive your business forward. Whether you're a budding entrepreneur or a seasoned professional looking to pivot, this ecommerce management course equips you with the knowledge to thrive in the digital marketplace. Don't let the e-commerce revolution pass you by – join us and transform your digital business acumen into tangible success. This amazing Ecommerce management course will teach you: Develop a winning e-commerce strategy for online success. Craft compelling content that attracts and engages customers. Leverage social media to build brand awareness and drive sales. Implement effective marketing strategies to reach your target audience. Design a user-friendly online experience that fosters conversions. Analyse e-commerce data to gain insights and optimise performance. Details Perks of Learning with IOMH One-To-One Support from a Dedicated Tutor Throughout Your Course. Study Online - Whenever and Wherever You Want. Instant Digital/ PDF Certificate. 100% Money Back Guarantee. 12 Months Access. Process of Evaluation After studying the course, an MCQ exam or assignment will test your skills and knowledge. You have to get a score of 60% to pass the test and get your certificate. Certificate of Achievement Certificate of Completion - Digital / PDF Certificate After completing the Ecommerce Management course, you can order your CPD Accredited Digital / PDF Certificate for £5.99. Certificate of Completion - Hard copy Certificate You can get the CPD Accredited Hard Copy Certificate for £12.99. Shipping Charges: Inside the UK: £3.99 International: £10.99 Who Is This Course for? This Ecommerce Management is suitable for anyone aspiring to start a career in relevant field; even if you are new to this and have no prior knowledge, this course is going to be very easy for you to understand. On the other hand, if you are already working in this sector, this course will be a great source of knowledge for you to improve your existing skills and take them to the next level. This course has been developed with maximum flexibility and accessibility, making it ideal for people who don't have the time to devote to traditional education. Requirements You don't need any educational qualification or experience to enrol in the Ecommerce Management course. Do note: you must be at least 16 years old to enrol. Any internet-connected device, such as a computer, tablet, or smartphone, can access this online course. Career Path The certification and skills you get from this Ecommerce Management Course can help you advance your career and gain expertise in several fields, allowing you to apply for high-paying jobs in related sectors. Course Curriculum Module 1: Introduction to Electronic Commerce Introduction to Electronic Commerce 00:16:00 Module 2: E-Commerce Strategy and Implementation E-Commerce Strategy and Implementation 00:18:00 Module 3: Customer Service Customer Service 00:19:00 Module 4: Products, Brands, and Services Products, Brands, and Services 00:28:00 Module 5: Content Planning and Production Content Planning and Production 00:11:00 Module 6: Use of Social Networks Use of Social Networks 00:15:00 Module 7: Marketing Marketing & Advertising 00:31:00 Module 8 - Creating an Engaging User Experience Creating an Engaging User Experience 00:11:00 Module 9 - Transaction Management Transaction Management 00:18:00 Module 10 - E-Commerce Analytics E-Commerce Analytics 00:11:00 Assignment Assignment - Ecommerce Management 00:00:00

School of Business Transformation
By Mindset Resource Consulting
Our Business Transformation Courses are aimed at empowering business professionals with knowledge and skills needed to transform business operations using modern business techniques, information technology, data analytics, and software tools. Here, we offer a number of foundation, intermediate, practitioner, professional and specialist courses leading to certifications by leading chartered institutes across the world.

Python for Data Analytics
By Nexus Human
Duration 3 Days 18 CPD hours This course is intended for This course is aimed at anyone who wants to harness the power of data analytics in their organization including: Business Analysts, Data Analysts, Reporting and BI professionals Analytics professionals and Data Scientists who would like to learn Python Overview This course teaches delegates with no prior programming or data analytics experience how to perform data manipulation, data analysis and data visualization in Python. Mastery of these techniques and how to apply them to business problems will allow delegates to immediately add value in their workplace by extracting valuable insight from company data to allow better, data-driven decisions. Outcome: After attending this course, delegates will: Be able to write effective Python code Know how to access their data from a variety of sources using Python Know how to identify and fix data quality using Python Know how to manipulate data to create analysis ready data Know how to analyze and visualize data to drive data driven decisioning across your organization Becoming a world class data analytics practitioner requires mastery of the most sophisticated data analytics tools. These programming languages are some of the most powerful and flexible tools in the data analytics toolkit. From business questions to data analytics, and beyond For data analytics tasks to affect business decisions they must be driven by a business question. This section will formally outline how to move an analytics project through key phases of development from business question to business solution. Delegates will be able: to describe and understand the general analytics process. to describe and understand the different types of analytics can be used to derive data driven solutions to business to apply that knowledge to their business context Basic Python Programming Conventions This section will cover the basics of writing R programs. Topics covered will include: What is Python? Using Anaconda Writing Python programs Expressions and objects Functions and arguments Basic Python programming conventions Data Structures in Python This section will look at the basic data structures that Python uses and accessing data in Python. Topics covered will include: Vectors Arrays and matrices Factors Lists Data frames Loading .csv files into Python Connecting to External Data This section will look at loading data from other sources into Python. Topics covered will include: Loading .csv files into a pandas data frame Connecting to and loading data from a database into a panda data frame Data Manipulation in Python This section will look at how Python can be used to perform data manipulation operations to prepare datasets for analytics projects. Topics covered will include: Filtering data Deriving new fields Aggregating data Joining data sources Connecting to external data sources Descriptive Analytics and Basic Reporting in Python This section will explain how Python can be used to perform basic descriptive. Topics covered will include: Summary statistics Grouped summary statistics Using descriptive analytics to assess data quality Using descriptive analytics to created business report Using descriptive analytics to conduct exploratory analysis Statistical Analysis in Python This section will explain how Python can be used to created more interesting statistical analysis. Topics covered will include: Significance tests Correlation Linear regressions Using statistical output to create better business decisions. Data Visualisation in Python This section will explain how Python can be used to create effective charts and visualizations. Topics covered will include: Creating different chart types such as bar charts, box plots, histograms and line plots Formatting charts Best Practices Hints and Tips This section will go through some best practice considerations that should be adopted of you are applying Python in a business context.

Advanced Analytics with Python
By Nexus Human
Duration 3 Days 18 CPD hours This course is intended for Before taking this course delegates should already be familiar with basic analytics techniques, comfortable with basic data manipulation tools such as spreadsheets and databases and already familiar with at least one programming language Overview This course teaches delegates who are already familiar with analytics techniques and at least one programming language how to effectively use the programming language for three tasks: data manipulation and preparation, statistical analysis and advanced analytics (including predictive modelling and segmentation). Mastery of these techniques will allow delegates to immediately add value in their work place by extracting valuable insight from company data to allow better, data-driven decisions. Outcomes: After completing the course, delegates will be capable of writing production-ready R code to perform advanced analytics tasks enabling their organisations make better, data-driven decisions. Becoming a world class data analytics practitioner requires mastery of the most sophisticated data analytics tools. These programming languages are some of the most powerful and flexible tools in the data analytics toolkit. Topic 1 Intro to our chosen language Topic 2 Basic programming conventions Topic 3 Data structures Topic 4 Accessing data Topic 5 Descriptive statistics Topic 6 Data visualisation Topic 7 Statistical analysis Topic 8 Advanced data manipulation Topic 9 Advanced analytics ? predictive modelling Topic 10 Advanced analytics ? segmentation
Python With Data Science
By Nexus Human
Duration 2 Days 12 CPD hours This course is intended for Audience: Data Scientists, Software Developers, IT Architects, and Technical Managers. Participants should have the general knowledge of statistics and programming Also familiar with Python Overview ? NumPy, pandas, Matplotlib, scikit-learn ? Python REPLs ? Jupyter Notebooks ? Data analytics life-cycle phases ? Data repairing and normalizing ? Data aggregation and grouping ? Data visualization ? Data science algorithms for supervised and unsupervised machine learning Covers theoretical and technical aspects of using Python in Applied Data Science projects and Data Logistics use cases. Python for Data Science ? Using Modules ? Listing Methods in a Module ? Creating Your Own Modules ? List Comprehension ? Dictionary Comprehension ? String Comprehension ? Python 2 vs Python 3 ? Sets (Python 3+) ? Python Idioms ? Python Data Science ?Ecosystem? ? NumPy ? NumPy Arrays ? NumPy Idioms ? pandas ? Data Wrangling with pandas' DataFrame ? SciPy ? Scikit-learn ? SciPy or scikit-learn? ? Matplotlib ? Python vs R ? Python on Apache Spark ? Python Dev Tools and REPLs ? Anaconda ? IPython ? Visual Studio Code ? Jupyter ? Jupyter Basic Commands ? Summary Applied Data Science ? What is Data Science? ? Data Science Ecosystem ? Data Mining vs. Data Science ? Business Analytics vs. Data Science ? Data Science, Machine Learning, AI? ? Who is a Data Scientist? ? Data Science Skill Sets Venn Diagram ? Data Scientists at Work ? Examples of Data Science Projects ? An Example of a Data Product ? Applied Data Science at Google ? Data Science Gotchas ? Summary Data Analytics Life-cycle Phases ? Big Data Analytics Pipeline ? Data Discovery Phase ? Data Harvesting Phase ? Data Priming Phase ? Data Logistics and Data Governance ? Exploratory Data Analysis ? Model Planning Phase ? Model Building Phase ? Communicating the Results ? Production Roll-out ? Summary Repairing and Normalizing Data ? Repairing and Normalizing Data ? Dealing with the Missing Data ? Sample Data Set ? Getting Info on Null Data ? Dropping a Column ? Interpolating Missing Data in pandas ? Replacing the Missing Values with the Mean Value ? Scaling (Normalizing) the Data ? Data Preprocessing with scikit-learn ? Scaling with the scale() Function ? The MinMaxScaler Object ? Summary Descriptive Statistics Computing Features in Python ? Descriptive Statistics ? Non-uniformity of a Probability Distribution ? Using NumPy for Calculating Descriptive Statistics Measures ? Finding Min and Max in NumPy ? Using pandas for Calculating Descriptive Statistics Measures ? Correlation ? Regression and Correlation ? Covariance ? Getting Pairwise Correlation and Covariance Measures ? Finding Min and Max in pandas DataFrame ? Summary Data Aggregation and Grouping ? Data Aggregation and Grouping ? Sample Data Set ? The pandas.core.groupby.SeriesGroupBy Object ? Grouping by Two or More Columns ? Emulating the SQL's WHERE Clause ? The Pivot Tables ? Cross-Tabulation ? Summary Data Visualization with matplotlib ? Data Visualization ? What is matplotlib? ? Getting Started with matplotlib ? The Plotting Window ? The Figure Options ? The matplotlib.pyplot.plot() Function ? The matplotlib.pyplot.bar() Function ? The matplotlib.pyplot.pie () Function ? Subplots ? Using the matplotlib.gridspec.GridSpec Object ? The matplotlib.pyplot.subplot() Function ? Hands-on Exercise ? Figures ? Saving Figures to File ? Visualization with pandas ? Working with matplotlib in Jupyter Notebooks ? Summary Data Science and ML Algorithms in scikit-learn ? Data Science, Machine Learning, AI? ? Types of Machine Learning ? Terminology: Features and Observations ? Continuous and Categorical Features (Variables) ? Terminology: Axis ? The scikit-learn Package ? scikit-learn Estimators ? Models, Estimators, and Predictors ? Common Distance Metrics ? The Euclidean Metric ? The LIBSVM format ? Scaling of the Features ? The Curse of Dimensionality ? Supervised vs Unsupervised Machine Learning ? Supervised Machine Learning Algorithms ? Unsupervised Machine Learning Algorithms ? Choose the Right Algorithm ? Life-cycles of Machine Learning Development ? Data Split for Training and Test Data Sets ? Data Splitting in scikit-learn ? Hands-on Exercise ? Classification Examples ? Classifying with k-Nearest Neighbors (SL) ? k-Nearest Neighbors Algorithm ? k-Nearest Neighbors Algorithm ? The Error Rate ? Hands-on Exercise ? Dimensionality Reduction ? The Advantages of Dimensionality Reduction ? Principal component analysis (PCA) ? Hands-on Exercise ? Data Blending ? Decision Trees (SL) ? Decision Tree Terminology ? Decision Tree Classification in Context of Information Theory ? Information Entropy Defined ? The Shannon Entropy Formula ? The Simplified Decision Tree Algorithm ? Using Decision Trees ? Random Forests ? SVM ? Naive Bayes Classifier (SL) ? Naive Bayesian Probabilistic Model in a Nutshell ? Bayes Formula ? Classification of Documents with Naive Bayes ? Unsupervised Learning Type: Clustering ? Clustering Examples ? k-Means Clustering (UL) ? k-Means Clustering in a Nutshell ? k-Means Characteristics ? Regression Analysis ? Simple Linear Regression Model ? Linear vs Non-Linear Regression ? Linear Regression Illustration ? Major Underlying Assumptions for Regression Analysis ? Least-Squares Method (LSM) ? Locally Weighted Linear Regression ? Regression Models in Excel ? Multiple Regression Analysis ? Logistic Regression ? Regression vs Classification ? Time-Series Analysis ? Decomposing Time-Series ? Summary Lab Exercises Lab 1 - Learning the Lab Environment Lab 2 - Using Jupyter Notebook Lab 3 - Repairing and Normalizing Data Lab 4 - Computing Descriptive Statistics Lab 5 - Data Grouping and Aggregation Lab 6 - Data Visualization with matplotlib Lab 7 - Data Splitting Lab 8 - k-Nearest Neighbors Algorithm Lab 9 - The k-means Algorithm Lab 10 - The Random Forest Algorithm