- Professional Development
- Medicine & Nursing
- Arts & Crafts
- Health & Wellbeing
- Personal Development
Pivot tables are really very easy to create, but very powerful. By using Excel pivot tables, one can get very interesting and valuable business intelligence from your data in very little time. This short session aims to give you the techniques to use this valuable Excel tool creatively. It is enough time to learn a lot about Excel Pivot Tables, but there is very little time for other questions.

PAINT A SET OF ABSTRACT COASTERS & TRAYS WITH PIZZA & BEER AT THE ITALIAN JOB IN HACKNEY WICK!
By Anna Kosa
Mix your Own Palette and create a set of coasters & a decorative tray while enjoying delicious pizza and Italian craft beers!

Belly dance course for beginners and improvers
By Jessica Gamil Bellydance
Learn the core moves of Egyptian Bellydance, and put it together with a fun choreography to Egyptian pop. We will learn: Correct posture and alignment. Hip movements (figures of eight/mayas (vertical and horizontal), circles and omis, different types of shimmies, drops and accents, locks, twists etc) Undulations and belly accents. Arm and hand positions, paths and movements. Common turns and stepping patterns used in bellydance e.g. pas de bourre. No belly dance experience required, if you are an improver you can refine and "troubleshoot" your base technique here to improve your movement quality. Variations will be offered in class depending on your level. There is also the opportunity to perform the choreography in the group at an end-of-term show (£10 ticket fee)! All classes are streamed and recorded on zoom so you can catch up if you miss a class. Homework with 1-2-1 feedback on WhatsApp included (optional) About your teacher: Jessica Gamil is an international performer, teacher and judge with over 16 years’ of Bellydance experience. Jessica has won Bellydance competitions in Italy and Switzerland, and travels to Cairo and festivals across the world to continue her dance training. Jessica is known for her easy to follow explanations of bellydance technique, so you’ll pick up new movements in no time!

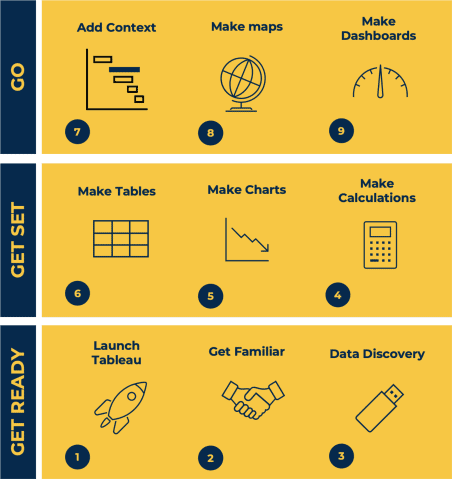
Tableau Desktop Training - Foundation
By Tableau Training Uk
This Tableau Desktop Training course is a jumpstart to getting report writers and analysts with little or no previous knowledge to being productive. It covers everything from connecting to data, through to creating interactive dashboards with a range of visualisations in two days of your time. For Private options, online or in-person, please send us details of your requirements: This Tableau Desktop Training course is a jumpstart to getting report writers and analysts with little or no previous knowledge to being productive. It covers everything from connecting to data, through to creating interactive dashboards with a range of visualisations in two days of your time. Having a quick turnaround from starting to use Tableau, to getting real, actionable insights means that you get a swift return on your investment of time and money. This accelerated approach is key to getting engagement from within your organisation so everyone can immediately see and feel the impact of the data and insights you create. This course is aimed at someone who has not used Tableau in earnest and may be in a functional role, eg. in sales, marketing, finance, operations, business intelligence etc. The course is split into 3 phases and 9 modules: PHASE 1: GET READY MODULE 1: LAUNCH TABLEAU Check Install & Setup Why is Visual Analytics Important MODULE 2: GET FAMILIAR What is possible How does Tableau deal with data Know your way around How do we format charts Dashboard Basics – My First Dashboard MODULE 3: DATA DISCOVERY Connecting to and setting up data in Tableau How Do I Explore my Data – Filters & Sorting How Do I Structure my Data – Groups & Hierarchies, Visual Groups How Tableau Deals with Dates – Using Discrete and Continuous Dates, Custom Dates Phase 2: GET SET MODULE 4: MAKE CALCULATIONS How Do I Create Calculated Fields & Why MODULE 5: MAKE CHARTS Charts that Compare Multiple Measures – Measure Names and Measure Values, Shared Axis Charts, Dual Axis Charts, Scatter Plots Showing Relational & Proportional Data – Pie Charts, Donut Charts, Tree Maps MODULE 6: MAKE TABLES Creating Tables – Creating Tables, Highlight Tables, Heat Maps Phase 3: GO MODULE 7: ADD CONTEXT Reference Lines and Bands MODULE 8: MAKE MAPS Answering Spatial Questions – Mapping, Creating a Choropleth (Filled) Map MODULE 9: MAKE DASHBOARDS Using the Dashboard Interface Dashboard Actions This training course includes over 25 hands-on exercises and quizzes to help participants “learn by doing” and to assist group discussions around real-life use cases. Each attendee receives a login to our extensive training portal which covers the theory, practical applications and use cases, exercises, solutions and quizzes in both written and video format. Students must use their own laptop with an active version of Tableau Desktop 2018.2 (or later) pre-installed. What People Are Saying About This Course “Excellent Trainer – knows his stuff, has done it all in the real world, not just the class room.”Richard L., Intelliflo “Tableau is a complicated and powerful tool. After taking this course, I am confident in what I can do, and how it can help improve my work.”Trevor B., Morrison Utility Services “I would highly recommend this course for Tableau beginners, really easy to follow and keep up with as you are hands on during the course. Trainer really helpful too.”Chelsey H., QVC “He is a natural trainer, patient and very good at explaining in simple terms. He has an excellent knowledge base of the system and an obvious enthusiasm for Tableau, data analysis and the best way to convey results. We had been having difficulties in the business in building financial reports from a data cube and he had solutions for these which have proved to be very useful.”Matthew H., ISS Group
10 practical ways to save time using ChatGPT and AI tools (In-House)
By The In House Training Company
ChatGPT, along with other AI tools, aims not to replace the human touch in management, but to enhance it. By addressing repetitive, daily tasks, these tools free up managers to concentrate on core responsibilities like strategic decision-making, team development, and innovation. As we move further into the digital age, integrating tools such as ChatGPT isn't a luxury; it's the future of proactive leadership. In this guide, we'll delve into 10 practical ways through which AI can elevate your efficiency and refine the quality of your work. Gain familiarity with prominent AI tools in the market Efficiently compose and respond to emails Generate concise summaries of complex reports and data. Obtain quick insights, data, and research across varied topics Streamline the writing of articles, training notes, and posts Craft interview tests, form relevant questions, and design checklists for the hiring process 1 Streamlining emails An inbox can be a goldmine of information but also a significant time drain for managers. Here's how to optimise it: Drafting responses: Give the AI a brief, and watch it craft a well-structured response. Sorting and prioritising: By employing user-defined rules and keywords, ChatGPT can flag important emails, ensuring no vital communication slips through the cracks. 2 Efficient report writing Reports, especially routine ones, can be time-intensive. Here's a smarter approach: Automate content: Supply key data points to the AI, and let it weave them into an insightful report. Proofreading: Lean on ChatGPT for grammar checks and consistency, ensuring each report remains crisp and error-free. 3 Rapid research From competitor insights to market trends, research is a pivotal part of management. Data synthesis: Feed raw data to the AI and receive succinct summaries in return. Question-answering: Pose specific questions about a dataset to ChatGPT and extract swift insights without diving deep into the entire content. 4 Reinventing recruitment Hiring can be a lengthy process. Here's how to make it more efficient: Resume screening: Equip the AI to spot keywords and qualifications, ensuring that only the most fitting candidates are shortlisted. Preliminary interviews: Leverage ChatGPT for the initial rounds of interviews by framing critical questions and evaluating the responses. 5 Enhancing training Especially for extensive teams, training can be a monumental task. Here's how ChatGPT can assist: Customised content: Inform the AI of your training goals, and it will draft tailored content suitable for various roles. PowerPoint design: Create visually appealing slide presentations on any topic in minimal time.

GCSE Tuition - Geography - In Person, London, Lambeth, Wandsworth, Merton, Southwark, Kensington & Chelsea
(8)By GLA Tutors Home or Online
Unlocking Success in GCSE Geography! At GLA Tutors, we are dedicated to helping students excel in their GCSE Geography examinations. Our experienced tutors are passionate about the subject and committed to providing comprehensive support tailored to the AQA examination board's specification. Let's dive into the breakdown of the AQA GCSE Geography specification: Paper 1: Living with the Physical Environment This paper focuses on understanding natural landscapes, such as rivers, coasts, and ecosystems. Our tutors will guide students through topics like the water cycle, coastal processes, and the impact of climate change. We offer in-depth explanations, interactive activities, and exam-style practice to build a solid foundation. Paper 2: Challenges in the Human Environment This paper explores the relationship between humans and their environment, including urban areas, development, and global issues. Our tutors will delve into concepts like population dynamics, urbanisation, sustainable development, and global inequalities. Through engaging discussions and real-world examples, we help students grasp the complexities of human geography. Paper 3: Geographical Applications In this paper, students apply their geographical skills to investigate real-world issues and carry out fieldwork. Our tutors will guide students through the process of designing and conducting fieldwork, collecting and analysing data, and presenting their findings. We provide practical guidance, research resources, and feedback to develop strong investigative skills. At GLA Tutors we go beyond the specification to nurture a deep understanding of geography. Our tutors create a supportive and engaging learning environment that encourages critical thinking, analysis, and effective exam techniques. We offer personalised one-on-one sessions, group discussions, and access to a range of learning materials to cater to each student's needs. Whether it's understanding the intricacies of physical processes or analysing the complexities of human interactions, our tutors are here to guide students towards success in their GCSE Geography journey. Join us and unlock your full potential in GCSE Geography! Feel free to explore our website for more information or reach out to us with any questions you may have. Let's embark on this exciting learning adventure together! https://www.globallearners.academy/services/gcse We can provide assistance for everything you need to prepare students for exams, including: past papers, mark schemes and examiners’ reports specimen papers and mark schemes for new courses exemplar student answers with examiner commentaries high quality revision guides

Visual Analytics Best Practice
By Tableau Training Uk
This course is very much a discussion, so be prepared to present and critically analyse your own and class mates work. You will also need to bring a few examples of work you have done in the past. Learning and applying best practice visualisation principles will improve effective discussions amongst decision makers throughout your organisation. As a result more end-users of your dashboards will be able to make better decisions, more quickly. This 2 Day training course is aimed at analysts with good working knowledge of BI tools (we use Tableau to present, but attendees can use their own software such as Power BI or Qlik Sense). It is a great preparation for taking advanced certifications, such as Tableau Certified Professional. Contact us to discuss the Visual Analytics Best Practice course Email us if you are interested in an on-site course, or would be interested in different dates and locations This Tableau Desktop training intermediate course is designed for the professional who has a solid foundation with Tableau and is looking to take it to the next level. Attendees should have a good understanding of the fundamental concepts of building Tableau worksheets and dashboards typically achieved from having attended our Tableau Desktop Foundation Course. At the end of this course you will be able to communicate insights more effectively, enabling your organisation to make better decisions, quickly. The Tableau Desktop Analyst training course is aimed at people who are used to working with MS Excel or other Business Intelligence tools and who have preferably been using Tableau already for basic reporting. The course includes the following topics: WHAT IS VISUAL ANALYSIS? Visual Analytics Visual Analytics Process Advantages of Visual Analysis Exercise: Interpreting Visualisations HOW DO WE PROCESS VISUAL INFORMATION? Memory and Processing Types Exercise: Identifying Types of Processing Cognitive Load Exercise: Analysing Cognitive Load Focus and Guide the Viewer Remove Visual Distractions Organise Information into Chunks Design for Proximity Exercise: Reducing Cognitive Load SENSORY MEMORY Pre-attentive Attributes Quantitatively-Perceived Attributes Categorically-Perceived Attributes Exercise: Analysing Pre-attentive Attributes Form & Attributes Exercise: Using Form Effectively Colour & Attributes Exercise: Using Colour Effectively Position & Attributes Exercise: Using Position Effectively ENSURING VISUAL INTEGRITY Informing without Misleading Gestalt Principles Visual Area Axis & Scale Colour Detail Exercise: Informing without Misleading CHOOSING THE RIGHT VISUALISATION Comparing and Ranking Categories Comparing Measures Comparing Parts to Whole Viewing Data Over Time Charts Types for Mapping Viewing Correlation Viewing Distributions Viewing Specific Values DASHBOARDS AND STORIES Exercise: Picking the Chart Type Exercise: Brainstorming Visual Best Practice Development Process for Dashboards and Stories Plan the Visualisation Create the Visualisation Test the Visualisation Exercise: Designing Dashboards and Stories This training course includes over 20 hands-on exercises to help participants “learn by doing” and to assist group discussions around real-life use cases. Each attendee receives an extensive training manual which covers the theory, practical applications and use cases, exercises and solutions together with a USB with all the materials required for the training. The course starts at 09:30 on the first day and ends at 17:00. On the second day the course starts at 09:00 and ends at 17:00. Students must bring their own laptop with an active version of Tableau Desktop 10.5 (or later) pre-installed. What People Are Saying About This Course "Steve was willing to address questions arising from his content in a full and understandable way"Lisa L. "Really enjoyed the course and feel the subject and the way it was taught was very close to my needs"James G. "The course tutor Steve was incredibly helpful and taught the information very well while making the two days very enjoyable."Bradd P. "The host and his courses will give you the tools and confidence that you need to be comfortable with Tableau."Jack S. "Steve was fantastic with his knowledge and knowhow about the product. Where possible he made sure you could put demonstrations in to working practice, to give the audience a clear understanding."Tim H. "This was a very interesting and helpful course, which will definitely help me produce smarter, cleaner visualisations that will deliver more data-driven insights within our business."Richard A. "Steve is very open to questions and will go out of his way to answer any query. Thank you"Wasif N. "Steve was willing to address questions arising from his content in a full and understandable way"Lisa L. "Really enjoyed the course and feel the subject and the way it was taught was very close to my needs"James G.

Peony hand-tied bouquet workshop @West 16th 15th May ‘25
By Wildside London
Its peony season and London is in bloom! What better way to celebrate by creating a beautiful bouquet of gorgeous peonies? Our clients all time favourite flowers and one we look forward to coming into season each year. Come join me in the studio at West 16th SE21 where we will learn the art of building a beautiful hand-tied bouquet of the best seasonal flowers. Mix a gorgeous selection of flowers, fillers and foliage using the 'spiralling' technique used by the pros. We will be chatting through peony varieties, how to get the most out of them and sharing lots of flower hacks, tips and tricks along the way. We finish by learning presentation techniques and you'll leave with your floral creation to enjoy at home. The workshop will be held in the studio of West 16th, SE21 who will supply drinks and snacks included within the workshop price.

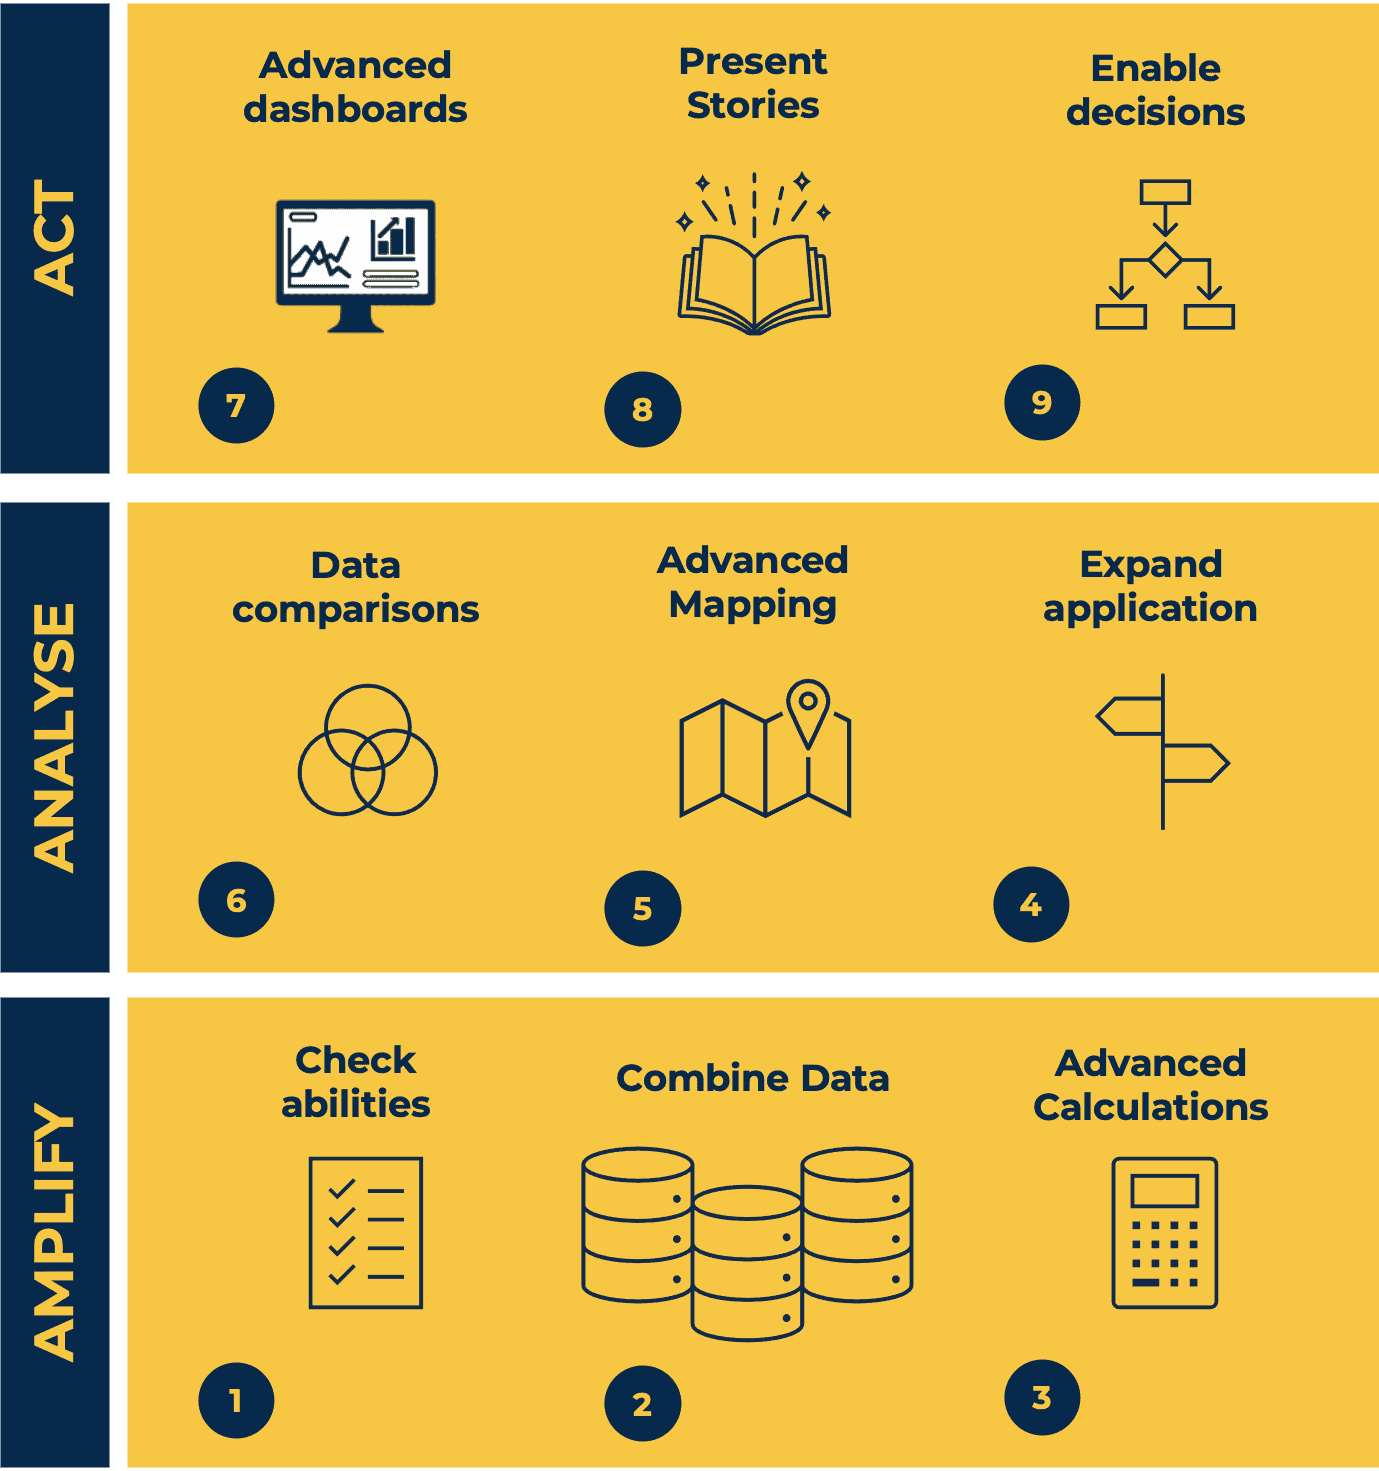
Tableau Desktop Training - Analyst
By Tableau Training Uk
This Tableau Desktop Training intermediate course is designed for the professional who has a solid foundation with Tableau and is looking to take it to the next level. For Private options, online or in-person, please send us details of your requirements: This Tableau Desktop training intermediate course is designed for the professional who has a solid foundation with Tableau and is looking to take it to the next level. Attendees should have a good understanding of the fundamental concepts of building Tableau worksheets and dashboards typically achieved from having attended our Tableau Desktop Foundation Course. At the end of this course you will be able to communicate insights more effectively, enabling your organisation to make better decisions, quickly. The Tableau Desktop Analyst training course is aimed at people who are used to working with MS Excel or other Business Intelligence tools and who have preferably been using Tableau already for basic reporting. The course is split into 3 phases and 9 modules: Phase 1: AMPLIFY MODULE 1: CHECK ABILITIES Revision – What I Should Know What is possibleHow does Tableau deal with dataKnow your way aroundHow do we format chartsHow Tableau deals with datesCharts that compare multiple measuresCreating Tables MODULE 2: COMBINE DATA Relationships Joining Tables – Join Types, Joining tables within the same database, cross database joins, join calculations Blending – How to create a blend with common fields, Custom defined Field relationships and mismatched element names, Calculated fields in blended data sources Unions – Manual Unions and mismatched columns, Wildcard unions Data Extracts – Creating & Editing Data extracts MODULE 3: ADVANCED CALCULATIONS Row Level v Aggregations Aggregating dimensions in calculations Changing the Level of Detail (LOD) of calculations – What, Why, How Adding Table Calculations Phase 2: ANALYSE MODULE 4: EXPAND APPLICATION Making things dynamic with parameters Sets Trend Lines How do we format charts Forecasting MODULE 5: ADVANCED MAPPING Using your own images for spatial analysis Mapping with Spatial files MODULE 6: DATA COMPARISONS Advanced Charts Bar in Bar charts Bullet graphs Creating Bins and Histograms Creating a Box & Whisker plot Phase 3: ACT MODULE 7: ADVANCED DASHBOARDS Using the dashboard interface and Device layout Dashboard Actions and Viz In tooltips Horizontal & Vertical containers Navigate between dashboards MODULE 8: PRESENT STORIES Telling data driven stories MODULE 9: ENABLE DECISIONS What is Tableau Server Publishing & Permissions How can your users engage with content This training course includes over 25 hands-on exercises and quizzes to help participants “learn by doing” and to assist group discussions around real-life use cases. Each attendee receives a login to our extensive training portal which covers the theory, practical applications and use cases, exercises, solutions and quizzes in both written and video format. Students must bring their own laptop with an active version of Tableau Desktop 2018.2 (or later) pre-installed. What People Are Saying About This Course “Course was fantastic, and completely relevant to the work I am doing with Tableau. I particularly liked Steve’s method of teaching and how he applied the course material to ‘real-life’ use-cases.”Richard W., Dashboard Consulting Ltd “This course was extremely useful and excellent value. It helped me formalise my learning and I have taken a lot of useful tips away which will help me in everyday work.” Lauren M., Baillie Gifford “I would definitely recommend taking this course if you have a working knowledge of Tableau. Even the little tips Steve explains will make using Tableau a lot easier. Looking forward to putting what I’ve learned into practice.”Aron F., Grove & Dean “Steve is an excellent teacher and has a vast knowledge of Tableau. I learned a huge amount over the two days that I can immediately apply at work.”John B., Mporium “Steve not only provided a comprehensive explanation of the content of the course, but also allowed time for discussing particular business issues that participants may be facing. That was really useful as part of my learning process.”Juan C., Financial Conduct Authority “Course was fantastic, and completely relevant to the work I am doing with Tableau. I particularly liked Steve’s method of teaching and how he applied the course material to ‘real-life’ use-cases.”Richard W., Dashboard Consulting Ltd “This course was extremely useful and excellent value. It helped me formalise my learning and I have taken a lot of useful tips away which will help me in everyday work.” Lauren M., Baillie Gifford “I would definitely recommend taking this course if you have a working knowledge of Tableau. Even the little tips Steve explains will make using Tableau a lot easier. Looking forward to putting what I’ve learned into practice.”Aron F., Grove & Dean “Steve is an excellent teacher and has a vast knowledge of Tableau. I learned a huge amount over the two days that I can immediately apply at work.”John B., Mporium