- Professional Development
- Medicine & Nursing
- Arts & Crafts
- Health & Wellbeing
- Personal Development

Excel - introduction (In-House)
By The In House Training Company
This one-day workshop is designed to give you an awareness of the fundamentals of Microsoft Excel and, in particular, to give you the confidence needed to efficiently create, edit and manage spreadsheets. This course will help participants: Create tables Use functions Manage rows and columns Write formulas Manage sheets Use content formats Handle larger tables Create reports and charts 1 Creating a table Creating an Excel table from scratch Wrapping text in cells Speeding up data entry using AutoFill Sorting columns 2 Inserting function Inserting function calculators Using AutoSum to sum numbers Statistical calculations AVERAGE, MAX and MIN 3 Table rows and columns Inserting and deleting rows and columns Adjusting multiple column widths and row heights Hiding and unhiding rows and columns 4 Formula writing The basics of formula writing Understanding mathematical symbols Using multiple mathematical symbols in a formula When to use brackets Troubleshooting calculation errors 5 Managing sheets Inserting, renaming, moving and deleting sheets Copying a worksheet to another file Copying a table to another sheet 6 Managing content formats Applying data formats Managing number formats Controlling formats with the Format Painter 7 Managing larger tables Applying freeze panes to lock tables when scrolling Sorting on multiple columns Using filters to extract table information 8 Creating and modifying charts Creating a pie chart Creating a column chart Inserting chart titles and data labels Controlling chart formatting Changing chart types 9 Printing Previewing and printing tables and charts Modifying page orientation Adjusting print margins Printing a selection 10 Calculating with absolute reference The difference between a relative and absolute formula Changing a relative formula to an absolute Using $ signs to lock cells when copying formulas 11 Pivot tables Create a pivot table report Insert a pivot chart into a report

Excel - intermediate (In-House)
By The In House Training Company
This one-day course focuses on issues such as writing formulas and accessing help while writing them, and taking formulas to the next level by nesting one inside another for a powerful formula result. It also looks at ways of analysing data with reports, summarised by varying criteria. A range of time-saving tips and tricks are shared. This course will help participants: Calculate with absolute reference Group worksheets Link to tables Use the function library effectively Get to grips with the logical IF function Use conditional formatting Create pivot table reports Use data validation Master the VLOOKUP function 1 Calculating with absolute reference The difference between a relative and absolute formula Changing a relative formula to an absolute Using $ signs to lock cells when copying formulas 2 Grouping worksheets Grouping sheets together Inputting data into multiple sheets Writing a 3D formula to sum tables across sheets 3 Linking to tables Linking to a source table Using paste link to link a table to another file Using edit links to manage linked tables 4 The function library Benefits of writing formulas in the function library Finding the right formula using insert function Outputting statistics with COUNTA and COUNTBLANK Counting criteria in a list with COUNTIFS 5 Logical IF Function Outputting results from tests Running multiple tests for multiple results The concept of outputting results from numbers 6 Conditional formatting Enabling text and numbers to standout Applying colour to data using rules Managing rules Copying rules with the format painter 7 View side by side Comparing two Excel tables together Comparing two sheets together in the same file 8 Pivot table reports Analysing data with pivot tables Managing a pivot table's layout Outputting statistical reports Controlling number formats Visualising reports with pivot charts Inserting slicers for filtering data 9 Data validation Restricting data input with data validation Speeding up data entry with data validation 10 VLOOKUP function Best practices for writing a VLOOKUP A false type lookup A true type lookup Enhance formula results with IFNA 11 Print options Getting the most from print Printing page titles across pages Scaling content for print
Word - introduction (In-House)
By The In House Training Company
This one-day workshop is designed to give participants an understanding of the fundamentals of Microsoft Word and its commands, with quick ways to enter text, control formatting and edit paragraphs. This course will help participants: Create, manage and save documents, files and folders Create paragraph lists, bulleted and numbered paragraphs Edit, modify and format paragraphs Create and format tables Use shortcuts to navigate documents Format the layout of documents Manage page headers and footers Insert and managing pictures and diagrams within a document Learn time saving tips and tricks to obtain a professional finish to documents Use printing options 1 Creating documents Getting help Creating and saving documents Accessing recently used documents Managing files and folders 2 Entering and editing text Inserting and editing paragraph text Cutting, copying and pasting text Using tool tips to manage content Applying and removing text formatting Correcting spelling and grammar 3 Creating paragraph lists Creating bulleted paragraphs Creating numbered paragraphs Managing bulleted and numbered lists 4 Modifying paragraphs Changing paragraph alignment Indenting a paragraph Adding borders and shading to paragraphs Formatting paragraphs using styles 5 Navigating documents Using shortcuts for navigating documents Using 'Go To' to navigate documents Finding and replacing text Changing to read view 6 Document layout Inserting page breaks Changing page orientation Adjusting page margins Adding borders to pages 7 Page headers and footers Inserting page headers and footers Using header and footer commands Inserting page numbers Using different first page 8 Inserting pictures and diagrams Inserting pictures from your computer Inserting online pictures Flowing text around a picture Changing a picture Inserting SmartArt diagrams Entering text into SmartArt 9 Inserting tables Using tabs to create tables Resizing and repositioning tables Inserting and deleting rows and columns Using a table's commands Changing a tables text direction Formatting tables 10 Printing documents Previewing and printing documents Using the printing tools Printing parts of a document
Excel - advanced (In-House)
By The In House Training Company
Most people only use a fraction of Excel's capabilities. This workshop shows what you've been missing! This course will help participants: Nest formulas Get the most from pivot tables Use conditional formatting Write array formulas Explore the lookup functions Calculate by criteria Use 'goal seek' and 'scenario manager' for what-if analysis Record macros 1 Nesting formulas Principles of nesting formulas together Using IF with AND or OR to answer questions Nesting an AND function in an IF Nesting an OR function in an IF 2 Advanced pivot table reports Grouping dates, numerical and text items Running percentage analyse Running analyses to compare data Inserting Field calculations Finishing off with a user-friendly dashboard 3 Advanced conditional formatting Colour table rows based on criteria in it Applying colour to approaching dates Exploring the different rule types 4 Lookup functions Going beyond the VLOOKUP function Lookups that retrieve data from left or right The versatile INDEX and MATCH functions Retrieving data from columns with duplicates 5 Calculate by criteria Using SUMIFS to sum by criteria Finding an average by criteria with AVERAGEIFS Use SUMPRODUCT to multiply then add different values 6 What-if analysis Use Goal Seek to meet targets Forecast reports with the Scenario Manager 7 Recording Macros Macro security Understanding a Relative References macro Recording, running and editing macros Saving files as Macro Enabled Workbooks Introduction to VBA code Making macros available across workbooks Add a macro button to the Quick Access toolbar
Power BI - introduction to intermediate (2 days) (In-House)
By The In House Training Company
This course starts with the basics then moves seamlessly to an intermediate level. It includes a comprehensive yet balanced look at the four main components that make up Power BI Desktop: Report view, Data view, Model view, and the Power Query Editor. It also demonstrates how to use the online Power BI service. It looks at authoring tools that enables you to connect to and transform data from a variety of sources, allowing you to produce dynamic reports using a library of visualisations. Once you have those reports, the course looks at the seamless process of sharing those with your colleagues by publishing to the online Power BI service. The aim of this course is to provide a strong understanding of the Power BI analysis process, by working with real-world examples that will equip you with the necessary skills to start applying your knowledge straight away. 1 Getting started The Power BI process Launching Power BI Desktop The four views of Power BI Dashboard visuals 2 Connecting to files Connect to data sources Connect to an Excel file Connect to a CSV file Connect to a database Import vs. DirectQuery Connect to a web source Create a data table 3 Transforming data The process of cleaning data Column data types Remove rows with filters Add a custom column Append data to a table Fix error issues Basic maths operations 4 Build a data model Table relationships Manage table relationships 5 Merge queries Table join kinds Merging tables 6 Create report visualisations Creating map visuals Formatting maps Creating chart visuals Formatting chart Tables, matrixes, and cards Control formatting with themes Filter reports with slicers Reports for mobile devices Custom online visuals Export report data to Excel 7 The power query editor Fill data up and down Split columns by delimiter Add conditional columns Merging columns 8 The M formula Creating M functions Create an IF function Create a query group 9 Pivot and unpivot tables Pivot tables in the query editor Pivot and append tables Pivot but don't summarise Unpivot tables Append mismatched headers 10 Data modelling revisited Data model relationships Mark a calendar as a date table 11 Introduction to calculated columns New columns vs. measures Creating a new column calculation The SWITCH function 12 Introduction to DAX measures Common measure categories The SUM measure Adding measures to visuals COUNTROWS and DISINCTCOUNT functions DAX rules 13 The CALCULATE measure The syntax of CALCULATE Things of note about CALCULATE 14 The SUMX measure The SUMX measure X iterator functions Anatomy of SUMX 15 Introduction to time intelligence Importance of a calendar table A special lookup table The TOTALYTD measure Change year end in TOTALYTD 16 Hierarchy, groups and formatting Create a hierarchy to drill data Compare data in groups Add conditional formatting 17 Share reports on the web Publish to the BI online service Get quick insights Upload reports from BI service Exporting report data What is Q&A? Sharing your reports 18 Apply your learning Post training recap lesson
Tableau Desktop Training - Analyst
By Tableau Training Uk
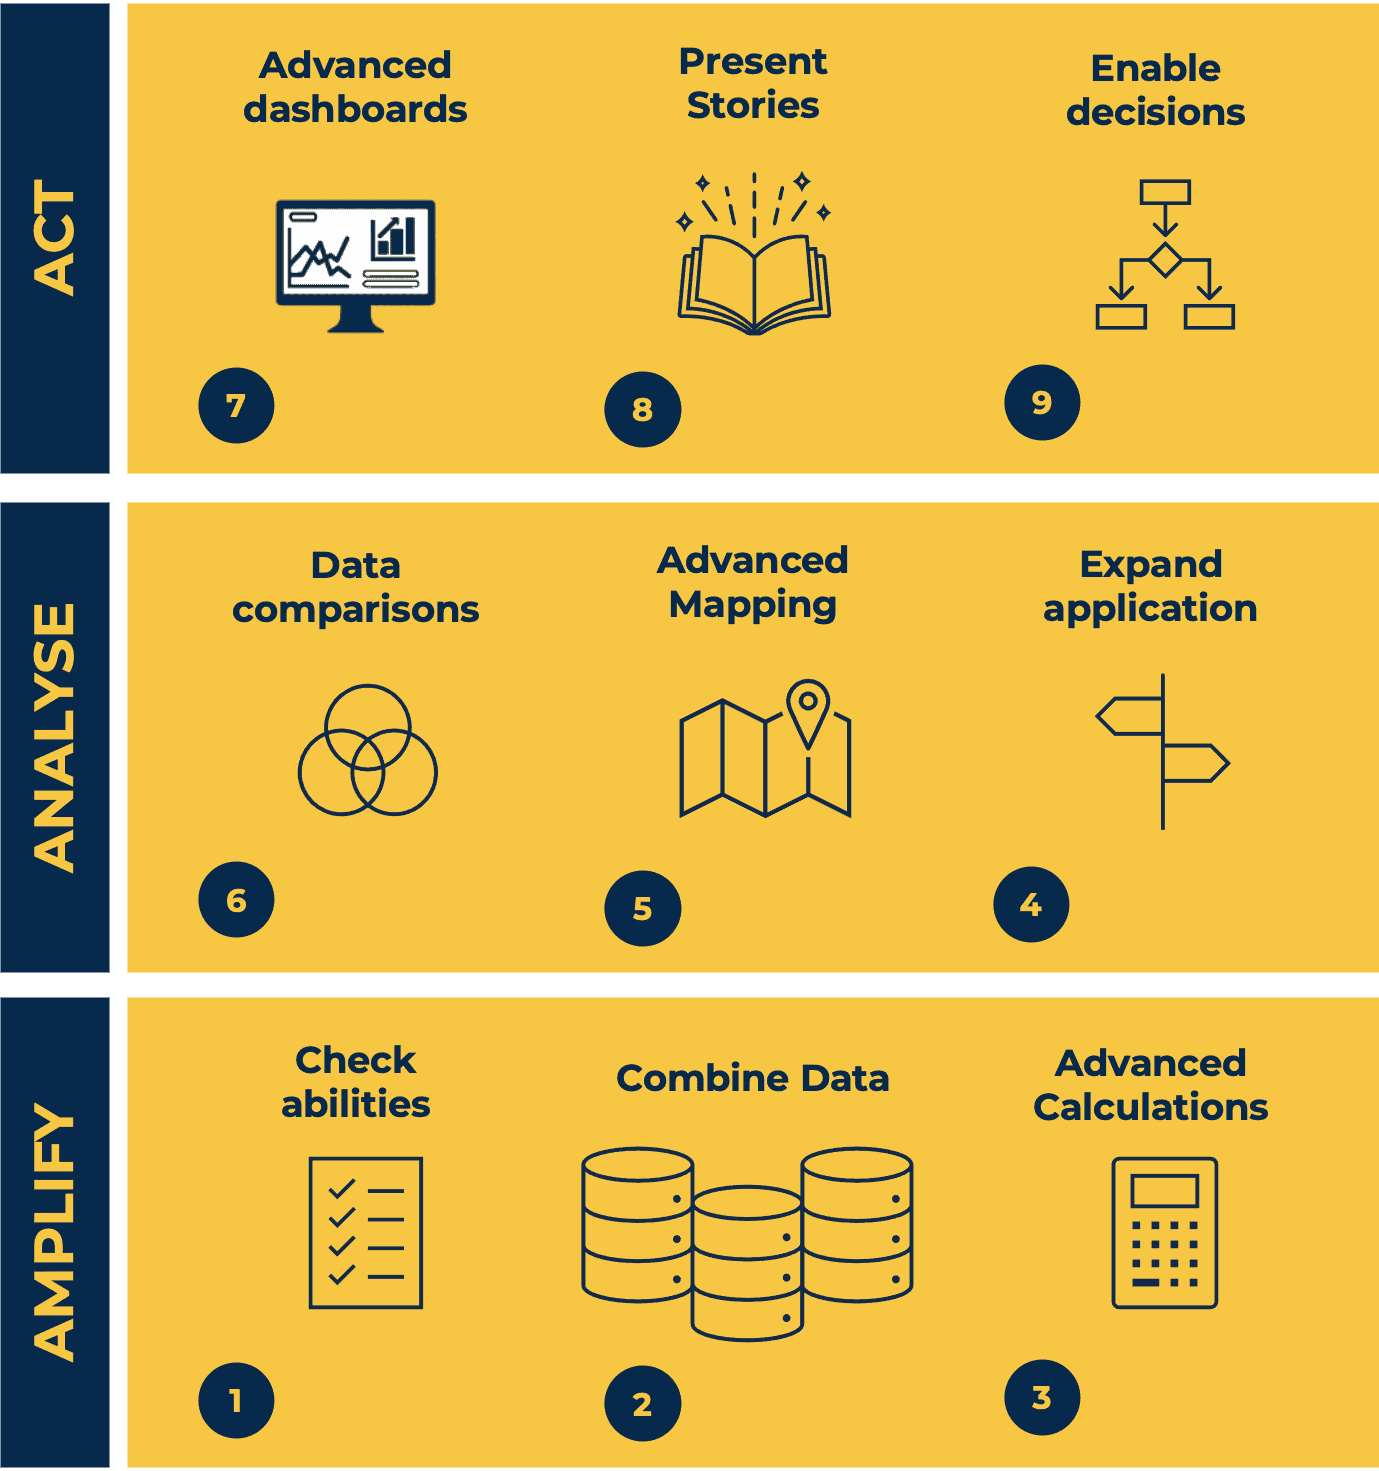
This Tableau Desktop Training intermediate course is designed for the professional who has a solid foundation with Tableau and is looking to take it to the next level. For Private options, online or in-person, please send us details of your requirements: This Tableau Desktop training intermediate course is designed for the professional who has a solid foundation with Tableau and is looking to take it to the next level. Attendees should have a good understanding of the fundamental concepts of building Tableau worksheets and dashboards typically achieved from having attended our Tableau Desktop Foundation Course. At the end of this course you will be able to communicate insights more effectively, enabling your organisation to make better decisions, quickly. The Tableau Desktop Analyst training course is aimed at people who are used to working with MS Excel or other Business Intelligence tools and who have preferably been using Tableau already for basic reporting. The course is split into 3 phases and 9 modules: Phase 1: AMPLIFY MODULE 1: CHECK ABILITIES Revision – What I Should Know What is possibleHow does Tableau deal with dataKnow your way aroundHow do we format chartsHow Tableau deals with datesCharts that compare multiple measuresCreating Tables MODULE 2: COMBINE DATA Relationships Joining Tables – Join Types, Joining tables within the same database, cross database joins, join calculations Blending – How to create a blend with common fields, Custom defined Field relationships and mismatched element names, Calculated fields in blended data sources Unions – Manual Unions and mismatched columns, Wildcard unions Data Extracts – Creating & Editing Data extracts MODULE 3: ADVANCED CALCULATIONS Row Level v Aggregations Aggregating dimensions in calculations Changing the Level of Detail (LOD) of calculations – What, Why, How Adding Table Calculations Phase 2: ANALYSE MODULE 4: EXPAND APPLICATION Making things dynamic with parameters Sets Trend Lines How do we format charts Forecasting MODULE 5: ADVANCED MAPPING Using your own images for spatial analysis Mapping with Spatial files MODULE 6: DATA COMPARISONS Advanced Charts Bar in Bar charts Bullet graphs Creating Bins and Histograms Creating a Box & Whisker plot Phase 3: ACT MODULE 7: ADVANCED DASHBOARDS Using the dashboard interface and Device layout Dashboard Actions and Viz In tooltips Horizontal & Vertical containers Navigate between dashboards MODULE 8: PRESENT STORIES Telling data driven stories MODULE 9: ENABLE DECISIONS What is Tableau Server Publishing & Permissions How can your users engage with content This training course includes over 25 hands-on exercises and quizzes to help participants “learn by doing” and to assist group discussions around real-life use cases. Each attendee receives a login to our extensive training portal which covers the theory, practical applications and use cases, exercises, solutions and quizzes in both written and video format. Students must bring their own laptop with an active version of Tableau Desktop 2018.2 (or later) pre-installed. What People Are Saying About This Course “Course was fantastic, and completely relevant to the work I am doing with Tableau. I particularly liked Steve’s method of teaching and how he applied the course material to ‘real-life’ use-cases.”Richard W., Dashboard Consulting Ltd “This course was extremely useful and excellent value. It helped me formalise my learning and I have taken a lot of useful tips away which will help me in everyday work.” Lauren M., Baillie Gifford “I would definitely recommend taking this course if you have a working knowledge of Tableau. Even the little tips Steve explains will make using Tableau a lot easier. Looking forward to putting what I’ve learned into practice.”Aron F., Grove & Dean “Steve is an excellent teacher and has a vast knowledge of Tableau. I learned a huge amount over the two days that I can immediately apply at work.”John B., Mporium “Steve not only provided a comprehensive explanation of the content of the course, but also allowed time for discussing particular business issues that participants may be facing. That was really useful as part of my learning process.”Juan C., Financial Conduct Authority “Course was fantastic, and completely relevant to the work I am doing with Tableau. I particularly liked Steve’s method of teaching and how he applied the course material to ‘real-life’ use-cases.”Richard W., Dashboard Consulting Ltd “This course was extremely useful and excellent value. It helped me formalise my learning and I have taken a lot of useful tips away which will help me in everyday work.” Lauren M., Baillie Gifford “I would definitely recommend taking this course if you have a working knowledge of Tableau. Even the little tips Steve explains will make using Tableau a lot easier. Looking forward to putting what I’ve learned into practice.”Aron F., Grove & Dean “Steve is an excellent teacher and has a vast knowledge of Tableau. I learned a huge amount over the two days that I can immediately apply at work.”John B., Mporium
Commercial awareness for project staff and engineers (In-House)
By The In House Training Company
Nowadays not only do we rely on our commercial and sales staff to hit that bottom line but we expect our engineers and project teams to play their part too - not only through their engineering and management skills but by behaving in a commercially minded way in their dealings with their counterparts in customer or supplier organisations. This means understanding, amongst other things, the issues surrounding the commencement of work ahead of contract, having a clear contract baseline, recognising the broader implications of contract change, the need for timeliness and the consequences of failing to meet the contracted timetable. This practical one-day programme has been designed specifically to give engineers, project staff and others just that understanding. The course is designed principally to provide engineers and project staff with an appreciation of contractual obligations, liabilities, rights and remedies so that they understand the implications of their actions. It is also suitable for business development staff who are negotiating contracts on behalf of the business. The main focus of the day is on creating an awareness of when a situation may have commercial implications that would harm an organisation's business interests if not recognised and handled appropriately and how taking a positive but more commercial approach to those situations can lead to a more positive outcome for the business. As well as providing an understanding of the commercial imperatives the day also focuses on specific areas affecting engineers and project staff, such as the recognition and management of change, the risks when working outside the contract and managing delays in contracts. The course identifies the different remedies that may apply according to the reasons for the delay and provides some thoughts on pushing back should such situations arise. On completion of this programme the participants will: appreciate the need for contractual controls and will have a better understanding of their relevance and how they can be applied, particularly the issues of starting work ahead of contract, implementing changes and inadvertently creating a binding contract by their behaviour; have gained an understanding of the terminology and procedural issues pertaining to contracting within a programme; and be more commercially aware and better equipped for their roles. 1 Basic contract law - bidding and contract formation Purpose of a contract Contract formation - the key elements required to create a legally binding agreement Completeness and enforceability Express and implied terms Conditions v warranties The use of, and issues arising from, standard forms of sale and purchase Use of 'subject to contract' Letters of intent Authority to commit 2 Change management Recognising changes to a contracted requirement Pricing change Implementation and management of change 3 Key contracting terms and conditions By the end of this module participants will be able to identify the key principles associated with: Pricing Getting paid and retaining payment Cashflow Delivery and acceptance Programme delaysExamining some reasons for non-performance...Customer failureContractor's failureNo fault delays ... and the consequences of non-performance: Damages claimsLiquidated damagesForce majeureContinued performance Waiver clauses and recent case law Use of best/reasonable endeavours Contract termination 4 Warranties, indemnities and liability Express and implied warranties Limiting liability 5 Protection of information Forms of intellectual property Background/foreground intellectual property Marking intellectual property Intellectual property rights Copyright Software Confidentiality agreements Internet