- Professional Development
- Medicine & Nursing
- Arts & Crafts
- Health & Wellbeing
- Personal Development
1141 Courses delivered Online
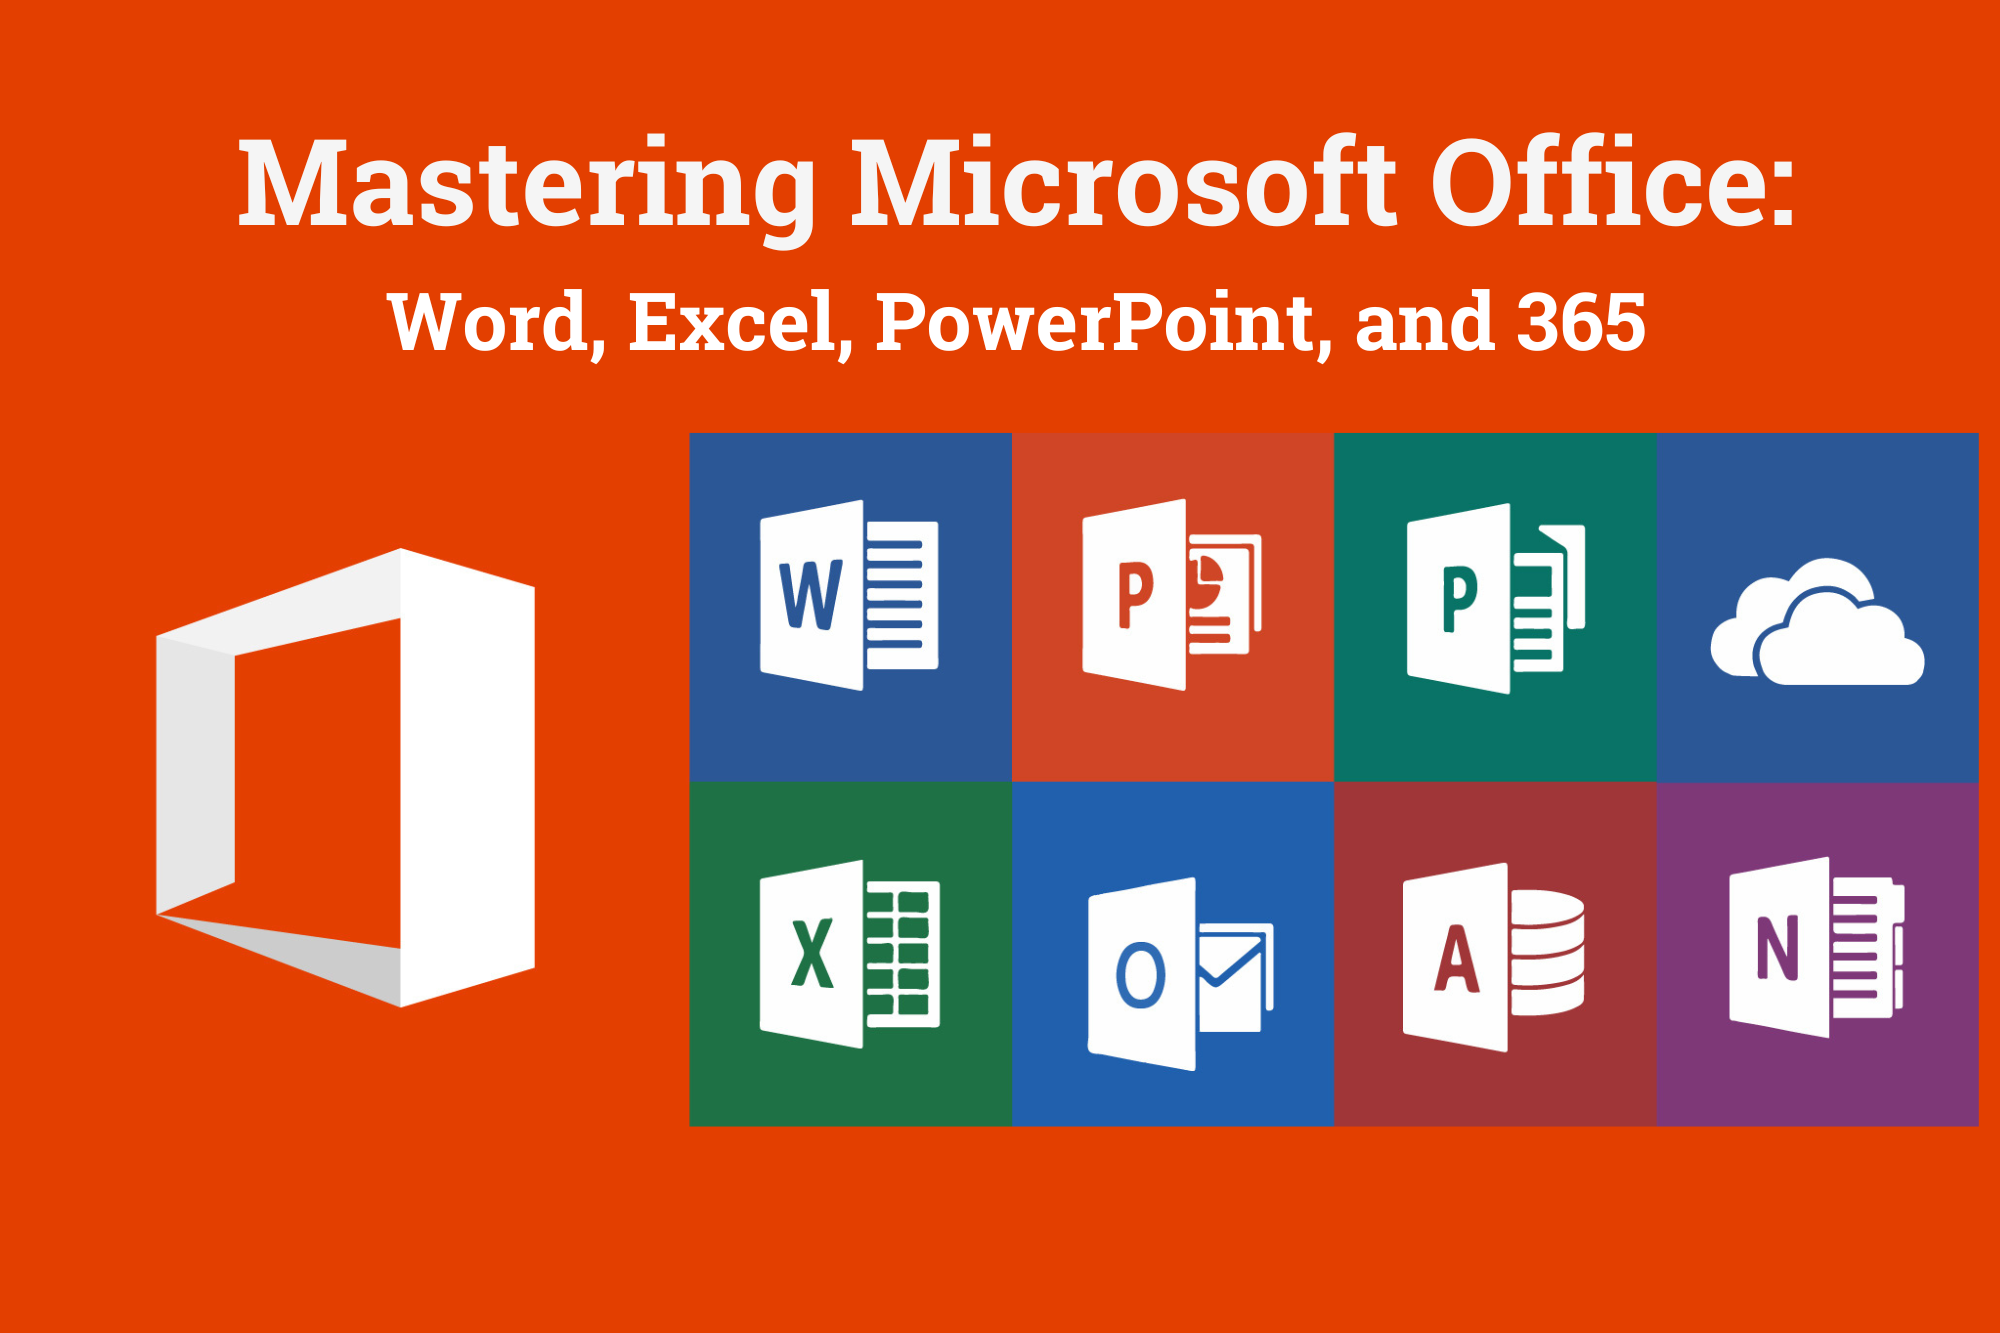
Mastering Microsoft Office: Word, Excel, PowerPoint, and 365
By IOMH - Institute of Mental Health
Microsoft Office skills are in high demand across industries, and proficiency in Microsoft Word, Microsoft Excel, Microsoft PowerPoint, and Microsoft Office 365 opens up numerous career opportunities. In the UK, administrative roles, data analysis positions, office management, project coordination, and marketing support roles are just a few examples of job prospects. With average salaries ranging from £20,000 to £45,000 per year, individuals with comprehensive Microsoft Office skills can secure stable employment and contribute to the success of various organisations. Enrol in the Ultimate Microsoft Office Skills Training course today and equip yourself with the knowledge and expertise needed to thrive in the ever-evolving workplace. You Will Learn Following Things: Develop a solid foundation in Microsoft Office applications, including Word, Excel, PowerPoint, and Office 365. Acquire essential skills to efficiently navigate and manipulate data in Microsoft Excel, such as organising, sorting, filtering, and writing formulas. Gain proficiency in creating professional presentations in Microsoft PowerPoint, utilising features like multimedia, transitions, animations, and smart graphics. Master the art of document creation and formatting in Microsoft Word, including tables, styles, page layouts, envelopes, labels, and mail merges. Understand advanced features like pivot tables, charts, and data analysis tools in Microsoft Excel, enabling effective data visualisation and decision-making. This course covers everything you must know to stand against the tough competition. The future is truly yours to seize with this Mastering Microsoft Office: Word, Excel, PowerPoint, and 365. Enrol today and complete the course to achieve a certificate that can change your career forever. Details Perks of Learning with IOMH One-to-one support from a dedicated tutor throughout your course. Study online - whenever and wherever you want. Instant Digital/ PDF certificate 100% money back guarantee 12 months access This course covers everything you must know to stand against the tough competition. The future is truly yours to seize with this Mastering Microsoft Office: Word, Excel, PowerPoint, and 365. Enrol today and complete the course to achieve a certificate that can change your career forever. Process of Evaluation After studying the course, your skills and knowledge will be tested with an MCQ exam or assignment. You have to get a score of 60% to pass the test and get your certificate. Certificate of Achievement After completing the Mastering Microsoft Office: Word, Excel, PowerPoint, and 365 course, you will receive your CPD-accredited Digital/PDF Certificate for £5.99. To get the hardcopy certificate for £12.99, you must also pay the shipping charge of just £3.99 (UK) and £10.99 (International). Who Is This Course for? This course is designed for individuals who want to enhance their Microsoft Office skills for personal or skilled purposes. Whether you are a student, an experienced entrepreneur, or anyone who regularly works with Microsoft Word, Excel, PowerPoint, and Office 365, this Microsoft Office skills course will provide you with a solid foundation and advanced techniques to maximise your productivity and efficiency. No prior experience is required, making it suitable for beginners and intermediate users looking to expand their knowledge and capabilities in the Microsoft Office suite. On the other hand, anyone who wants to establish their career as: like MS Office User Microsoft Office 2019 User Touch Typing Worker Audio Typist Can take this Ultimate Microsoft Office Skills Training (Word, Excel, PowerPoint, and 365) course. Requirements There is no prerequisite to enrol in this course. You don't need any educational qualification or experience to enrol in the Mastering Microsoft Office: Word, Excel, PowerPoint, and 365 course. Do note: you must be at least 16 years old to enrol. Any internet-connected device, such as a computer, tablet, or smartphone, can access this online course. Career path Administrative Assistant - £20K to £30K/year Data Analyst - £25K to £45K/year Office Manager - £25K to £40K/year Project Coordinator - £25K to £35K/year Marketing Assistant - £20K to £30K/year Course Curriculum Section 01: Getting Started Introduction 00:03:00 Getting started on Windows, macOS, and Linux 00:01:00 How to ask great questions 00:01:00 FAQ's 00:01:00 Section 02: Excel 2021: Basics Excel Overview 00:05:00 Start Excel Spreadsheet 00:04:00 Enter Text and Numbers 00:07:00 Relative References 00:04:00 Working with ranges 00:07:00 Save and Save as Actions 00:08:00 File Extensions, Share, Export, and Publish files 00:06:00 Section 03: Excel 2021: Rows, Columns, and Cells Adding Rows and Columns 00:03:00 Modifying Rows and Column lengths 00:05:00 Section 04: Excel 2021: Data Handling Copy, Cut, and Paste 00:07:00 Copying Formulas 00:03:00 Section 05: Excel 2021: Page Setting Up and Print Page setup options 00:06:00 Fit to print on One Page 00:03:00 Print Workbooks 00:03:00 Section 06: Excel 2021: Sorting and Filtering Sorting Data Ascending Order 00:04:00 Sorting Data Descending Order 00:02:00 Filter Data 00:04:00 Section 07: Excel 2021: Writing Formulas Creating Basic Formulas 00:06:00 Datetime Formulas 00:06:00 Mathematical formulas phase1 00:20:00 Mathematical formulas phase2 00:12:00 Section 08: Excel 2021: Advanced Formulas VLOOKUP formula 00:12:00 HLOOKUP formula 00:04:00 Section 09: Excel 2021: XLOOKUP only for 2021 and Office 365 XLOOKUP 00:08:00 Handling #NA and Approximates match in XLOOKUP 00:11:00 Section 10: Excel 2021: Data and Tools Split Text into columns 00:07:00 Flash Fill 00:07:00 Data Validation 00:07:00 Remove Duplicates 00:08:00 Import Data from Text files 00:06:00 Import Data from .CSV files 00:03:00 Section 11: Excel 2021: Formatting data and tables Formatting Font 00:04:00 Formatting Alignment 00:06:00 Formatting Numbers 00:05:00 Formatting Date 00:03:00 Formatting Tables 00:05:00 Section 12: Excel 2021: Pivot Tables Pivot Tables 00:07:00 Pivot Charts 00:02:00 Section 13: Excel 2021: Charts Excel Charts - Categories 00:03:00 Elements of a chart 00:04:00 Creating Charts 00:02:00 Column or Bar charts 00:04:00 Formatting charts 00:04:00 Line Charts 00:02:00 Pie and Doughnut charts 00:04:00 Section 14: PowerPoint 2021: Course Introduction Overview 00:04:00 Start PowerPoint Presentation 00:05:00 Screen setting and Views 00:05:00 Section 15: PowerPoint 2021: Basics Presentation Tips and Guidelines 00:06:00 Creating a New Presentation 00:04:00 Working with Slides 00:04:00 Save a Presentation 00:04:00 Print Slides 00:03:00 Section 16: PowerPoint 2021: Text and Bullet Options Formatting Text 00:05:00 Slide Text Alignments 00:03:00 Multi-Column Text Alignments 00:02:00 Adding Bullets and Numbered List Items 00:03:00 Section 17: PowerPoint 2021: Adding Graphic Assets Insert Shapes 00:03:00 Insert Icons 00:03:00 Insert Graphics 00:04:00 Add 3D Models 00:03:00 Insert Pictures 00:03:00 Section 18: PowerPoint 2021: Picture Formatting Picture Options 00:04:00 Picture Cropping 00:03:00 Applying Built-in Picture Styles 00:04:00 Section 19: PowerPoint 2021: SmartArt Graphics Add SmartArt Graphic 00:03:00 Modifying SmartArt 00:03:00 Creating a Target Chart using SmartArt 00:03:00 Section 20: PowerPoint 2021: Working with Tables Create a Table on Slide 00:04:00 Formatting Tables 00:02:00 Inserting Tables 00:02:00 Table Layouts 00:01:00 Section 21: PowerPoint 2021: Working with Charts Add a Chart 00:02:00 Formatting Charts 00:02:00 Insert Chart from Microsoft Excel 00:03:00 Section 22: PowerPoint 2021: Adding Multimedia Adding Video to a Presentation 00:03:00 Adding Audio to a Presentation 00:02:00 Screen Recording and Adding 00:02:00 Section 23: PowerPoint 2021: Working with Transition Applying Transitions to Presentation 00:04:00 Section 24: PowerPoint 2021: Animation Object Animation 00:03:00 Effect Options 00:02:00 Advanced Animation 00:02:00 Triggers to control animation 00:02:00 Section 25: PowerPoint 2021: Slideshow Effects Onscreen Presentation 00:02:00 Hiding Slides 00:02:00 Changing Order of Slides 00:02:00 Copying Slides 00:02:00 Section 26: Word 2021: Introduction Overview of MS Word 00:04:00 Start MS Word 2021 00:05:00 Section 27: Word 2021: Basics Create a new blank document 00:04:00 Creating a paragraph text 00:05:00 Non-printing characters 00:03:00 Save a document 00:03:00 Open a document 00:01:00 Find and replace 00:04:00 Section 28: Word 2021: Word Formatting AutoCorrect options 00:03:00 Formatting text 00:04:00 Copy cut and paste 00:04:00 Character formatting 00:02:00 Format painter 00:04:00 Work with numbers 00:02:00 Add bullets 00:03:00 Outline creation 00:04:00 Section 29: Word 2021: Tables Creating a table 00:03:00 Adding rows and columns to a table 00:02:00 Formatting table data 00:02:00 Borders and shading 00:02:00 Sorting in a table 00:04:00 Draw a table 00:04:00 Convert text to table 00:03:00 Convert table to text 00:02:00 Insert a spreadsheet 00:02:00 Quick tables - readily available formats 00:02:00 Section 30: Word 2021: Styles Working with styles 00:02:00 Creating styles 00:02:00 Clear formatting 00:01:00 Section 31: Word 2021: Page Layout Margins 00:02:00 Orientation 00:01:00 Page size setting 00:01:00 Adding columns 00:03:00 Page break - section break 00:02:00 Adding watermark 00:03:00 Headers and footers 00:03:00 Section 32: Word 2021: Envelops and Lables Create envelops 00:02:00 Creating labels 00:02:00 Section 33: Word 2021: Mail Merges Creating a mail merge document 00:03:00 Section 34: Word 2021: Review and Printing Thesaurus and spell check 00:01:00 Word count 00:01:00 Speech - read aloud 00:01:00 Language - translate 00:01:00 Tracking 00:01:00
Register on the Google Data Studio: Data Analytics today and build the experience, skills and knowledge you need to enhance your professional development and work towards your dream job. Study this course through online learning and take the first steps towards a long-term career. The course consists of a number of easy to digest, in-depth modules, designed to provide you with a detailed, expert level of knowledge. Learn through a mixture of instructional video lessons and online study materials. Receive online tutor support as you study the course, to ensure you are supported every step of the way. Get an e-certificate as proof of your course completion. The Google Data Studio: Data Analytics is incredibly great value and allows you to study at your own pace. Access the course modules from any internet-enabled device, including computers, tablet, and smartphones. The course is designed to increase your employability and equip you with everything you need to be a success. Enrol on the now and start learning instantly! What You Get With The Google Data Studio: Data Analytics Receive a e-certificate upon successful completion of the course Get taught by experienced, professional instructors Study at a time and pace that suits your learning style Get instant feedback on assessments 24/7 help and advice via email or live chat Get full tutor support on weekdays (Monday to Friday) Course Design The course is delivered through our online learning platform, accessible through any internet-connected device. There are no formal deadlines or teaching schedules, meaning you are free to study the course at your own pace. You are taught through a combination of Video lessons Online study materials Certification Upon successful completion of the course, you will be able to obtain your course completion e-certificate free of cost. Print copy by post is also available at an additional cost of £9.99 and PDF Certificate at £4.99. Who Is This Course For: The course is ideal for those who already work in this sector or are an aspiring professional. This course is designed to enhance your expertise and boost your CV. Learn key skills and gain a professional qualification to prove your newly-acquired knowledge. Requirements: The online training is open to all students and has no formal entry requirements. To study the Google Data Studio: Data Analytics, all your need is a passion for learning, a good understanding of English, numeracy, and IT skills. You must also be over the age of 16. Course Content Section 01: Introduction Course Overview 00:01:00 Section 02: Google Sheets Format Data in Google Sheets 00:08:00 Sheets Function 2: Vlookup & Defined Range 00:10:00 Sheets Function 3: Cross Table Calculations 00:09:00 Section 03: Google Data Studio Connect Data to Google Data Studio 00:04:00 GDS Calculated Fields 00:08:00 GDS Theme Customization 00:07:00 GDS Page Layout Design 00:17:00 GDS Charts: Scorecards 00:12:00 GDS Charts: Time Series Graphs 00:09:00 GDS Blending and Joining Data Tables 00:07:00 GDS Charts: Bar, Donut, and Treemap 00:17:00 GDS Charts: Interactive Filters 00:05:00 GDS Project Page Completion 00:17:00 GDS Client Page Completion 00:11:00 Frequently Asked Questions Are there any prerequisites for taking the course? There are no specific prerequisites for this course, nor are there any formal entry requirements. All you need is an internet connection, a good understanding of English and a passion for learning for this course. Can I access the course at any time, or is there a set schedule? You have the flexibility to access the course at any time that suits your schedule. Our courses are self-paced, allowing you to study at your own pace and convenience. How long will I have access to the course? For this course, you will have access to the course materials for 1 year only. This means you can review the content as often as you like within the year, even after you've completed the course. However, if you buy Lifetime Access for the course, you will be able to access the course for a lifetime. Is there a certificate of completion provided after completing the course? Yes, upon successfully completing the course, you will receive a certificate of completion. This certificate can be a valuable addition to your professional portfolio and can be shared on your various social networks. Can I switch courses or get a refund if I'm not satisfied with the course? We want you to have a positive learning experience. If you're not satisfied with the course, you can request a course transfer or refund within 14 days of the initial purchase. How do I track my progress in the course? Our platform provides tracking tools and progress indicators for each course. You can monitor your progress, completed lessons, and assessments through your learner dashboard for the course. What if I have technical issues or difficulties with the course? If you encounter technical issues or content-related difficulties with the course, our support team is available to assist you. You can reach out to them for prompt resolution.

Embark on a transformative journey into the realm of data mastery with our comprehensive course, 'Advanced SAS Programming Using MacrosSQL.' From demystifying the intricacies of SAS Studio to unlocking the potential of Proc SQL, this course is a gateway to proficiency in SAS programming and macro scripting. The curriculum, thoughtfully designed to accommodate learners of all levels, takes you through the essential foundations of SAS, the nuances of macro variables, and the power-packed functionalities of Proc SQL. Dive into the world of nested macro variables, conditional logic, and data manipulation, all while honing your skills through practical examples. This course isn't just about learning syntax; it's a hands-on exploration that empowers you to seamlessly connect the dots between SAS Studio and Proc SQL, bringing your data analytics capabilities to new heights. Learning Outcomes Master the fundamentals of SAS Studio and navigate through its interface effortlessly. Develop a deep understanding of macro variables, exploring their applications and delving into nested variations. Acquire proficiency in SAS Macros, from basic examples to advanced keyword usage and conditional logic. Unlock the potential of Proc SQL, gaining expertise in data copying, filtering, sorting, and removing duplicates. Harness the power of data merging using Joins, creating macro variables dynamically in the process. Why choose this Advanced SAS Programming Using MacrosSQL course? Unlimited access to the course for a lifetime. Opportunity to earn a certificate accredited by the CPD Quality Standards and CIQ after completing this course. Structured lesson planning in line with industry standards. Immerse yourself in innovative and captivating course materials and activities. Assessments designed to evaluate advanced cognitive abilities and skill proficiency. Flexibility to complete the Course at your own pace, on your own schedule. Receive full tutor support throughout the week, from Monday to Friday, to enhance your learning experience. Unlock career resources for CV improvement, interview readiness, and job success. Who is this Advanced SAS Programming Using MacrosSQL course for? Data enthusiasts seeking to enhance their SAS programming skills. Business analysts aiming to leverage SAS for more effective data analysis. IT professionals aspiring to streamline data management through SAS. Career path SAS Programmer: £35,000 - £55,000 Data Analyst: £30,000 - £50,000 Business Intelligence Developer: £40,000 - £60,000 Database Administrator: £35,000 - £60,000 Data Scientist: £45,000 - £70,000 Analytics Manager: £50,000 - £80,000 Prerequisites This Advanced SAS Programming Using MacrosSQL does not require you to have any prior qualifications or experience. You can just enrol and start learning.This Advanced SAS Programming Using MacrosSQL was made by professionals and it is compatible with all PC's, Mac's, tablets and smartphones. You will be able to access the course from anywhere at any time as long as you have a good enough internet connection. Certification After studying the course materials, there will be a written assignment test which you can take at the end of the course. After successfully passing the test you will be able to claim the pdf certificate for £4.99 Original Hard Copy certificates need to be ordered at an additional cost of £8. Course Curriculum Advanced SAS Programming Using MacrosSQL Unit - 1 Section 0-00- Why SAS 00:01:00 Unit - 2 Section 2-02- SAS Studio through SAS OnDemand- Registration 00:04:00 Section 2-03- Logging-in to SAS after installation 00:01:00 Section 2-04- SAS Interface and windows 00:06:00 Unit - 3 Section 3-00- Section Overview - Macros 00:01:00 Section 3-01-Macro Variables - introduction 00:14:00 Section 3-02-Application of macro variables 00:13:00 Section 3-03-01-Nested macro vars 00:11:00 Section 3-03-02-More on Ampersand resolutions using a cool example 00:09:00 Section 3-04-00-SAS Macros - introduction 00:10:00 Section 3-04-01-SAS Macros - Examples 00:07:00 Section 3-04-02-Keyword positional and mixed params 00:06:00 Section 3-04-03-Conditional Logic in Macros 00:11:00 Section 3-05-Macro Functions 00:12:00 Section 3-05-Options Statement- mprint-mlogic-symbolgen 00:13:00 Section 3-07-Connecting the two worlds - Call Symput - Symget 00:14:00 Section 3-09-01-02- Bringing data into SAS using Import Wizard 00:04:00 Section 3-09-02- Bringing data into SAS using LIBNAME statement 00:05:00 Section 3-09-03- Bringing data into SAS using FILENAME 00:05:00 Unit - 4 Section 4-00- Section Overview - Proc SQL 00:01:00 Section 4-01-01-Proc SQL - copying data 00:13:00 Section 4-01-02-Proc SQL - filtering data 00:07:00 Section 4-01-03-Proc SQL - sorting data 00:08:00 Section 4-01-04-Proc SQL - removing duplicates 00:05:00 Section 4-02-01-Proc SQL - Union 00:09:00 Section 4-02-02-Proc SQL - Except 00:04:00 Section 4-02-03-Proc SQL - Intersect 00:02:00 Section 4-03-00-Merging data using Joins-Introduction 00:08:00 Section 4-03-01-Proc SQL - inner join 00:14:00 Section 4-03-02-Proc SQL - full join 00:08:00 Section 4-03-03-Proc SQL - left and right joins 00:07:00 Section 4-04-01-Proc SQL - creating macro vars 00:07:00 Unit - 5 Section 5-00- Bonus lecture 00:02:00

CRM: Customer Relationship Management - CPD Accredited
By Wise Campus
CRM: Customer Relationship Management Would you want to learn about various methods for choosing tools and the best ways to keep customers? Our in-depth CRM Course (Customer Relationship Management) will assist you in expanding your knowledge about the CRM sector. Our CRM Course (Customer Relationship Management) provides an introduction to Customer Relationship Management (CRM) along with its all functions. Also, the CRM Course (Customer Relationship Management) explains CRM strategies, and data analysis in CRM and CRM Databases. Moreover, this CRM Course (Customer Relationship Management) includes difficulties handling processes. Additionally, the CRM Course (Customer Relationship Management) explain how to deepen the customer relationship and the future of CRM. Enhance your organisational efficiency and maximise business growth through our effective CRM Course (Customer Relationship Management) practices! Learning Outcome of CRM Course (Customer Relationship Management) This CRM Course (Customer Relationship Management) will teach you about: Introduction to CRM Course (Customer Relationship Management). The CRM Course (Customer Relationship Management) explains CRM fundamentals. CRM Course (Customer Relationship Management) also includes CRM strategies. Data analysis in CRM and collecting CRM databases are parts of this CRM Course (Customer Relationship Management). Through the CRM Course (Customer Relationship Management), you will learn about deepening customer relationships. Handling customer complaints and the future of CRM is elaborately explained in this CRM Course (Customer Relationship Management). Special Offers of this CRM: Customer Relationship Management Course This CRM: Customer Relationship Management Course includes a FREE PDF Certificate. Lifetime access to this CRM: Customer Relationship Management Course Instant access to this CRM: Customer Relationship Management Course Get FREE Tutor Support to this CRM: Customer Relationship Management Course CRM: Customer Relationship Management Unlock the potential of your business with our CRM: Customer Relationship Management course. This CRM: Customer Relationship Management course provides a comprehensive introduction to all CRM functions, ensuring you grasp the fundamentals of managing customer relationships. You’ll explore effective CRM: Customer Relationship Management strategies, master data analysis in CRM, and gain expertise in navigating CRM databases. Additionally, our CRM: Customer Relationship Management course covers the intricacies of handling process challenges, helping you deepen customer relationships. Plus, you'll get insights into the future of CRM: Customer Relationship Management, making this course your gateway to mastering customer engagement. Who is this course for? CRM: Customer Relationship Management This CRM: Customer Relationship Management is intended for individuals who wish to enhance their company chances and cultivate solid client connections. Requirements CRM: Customer Relationship Management To enrol in this CRM: Customer Relationship Management Course, students must fulfil the following requirements. To join in our CRM: Customer Relationship ManagementCourse, you must have a strong command of the English language. To successfully complete our CRM: Customer Relationship Management Course, you must be vivacious and self driven. To complete our CRM: Customer Relationship Management Course, you must have a basic understanding of computers. A minimum age limit of 15 is required to enrol in this CRM: Customer Relationship Management Course. Career path CRM: Customer Relationship Management You may work as a manager, customer service manager, CRM analyst, and many other roles after finishing this CRM: Customer Relationship Management!
Data Entry, Touch Typing & Microsoft Excel Training for Virtual Assistant & Executive PA
(47)By Academy for Health and Fitness
24-Hour Flash Sale! Prices Reduced Like Never Before!! Limited Time Offer: Virtual Assistant Training | Data Entry Administrator | Touch Typing | Personal Assistant Training From planning the meetings to business writing, a PA or a Virtual Assistant has to carry out various roles and responsibilities. Therefore, recruiters look for individuals who possess the skills and expertise to carry out these wide ranges of duties of PA or a Virtual Assistant. The Virtual Assistant & PA with Data Entry, Touch Typing & Microsoft Office Skills Course is designed to assist you in acquiring the essential skills to impress recruiters. It will enlighten you on all the core elements of a secretarial job within only a few steps. This comprehensive Virtual Assistant bundle offers everything you need to launch a successful career as a VA or PA. You'll gain proficiency in high-speed, accurate Data Entry, master Touch Typing for efficient task completion, and develop advanced Microsoft Excel skills for data analysis and presentation. Additionally, you'll learn the fundamentals of Virtual Assistance and Personal Assistant duties, providing you with a well-rounded skillset to impress potential clients. Courses are Included in this Virtual Assistant & PA with Data Entry, Touch Typing & Microsoft Excel Training Bundle: Course 01: Virtual Assistant at QLS Level 2 Course 02: PA - Personal Assistant Course Course 03: Data Entry Administrator at QLS Level 3 Course 04: Certificate in Touch Typing Course 05: Microsoft Excel - Beginner, Intermediate & Advanced Step into a career that offers flexibility, variety, and the opportunity to work with diverse clients around the globe. By completing this Virtual Assistant course, you'll boost your employability and gain the confidence to manage business operations smoothly and effectively. So, enrol now! Learning Outcomes of Virtual Assistant & PA with Data Entry, Touch Typing & Microsoft Excel Training: Master data entry techniques for efficient and error-free information processing Achieve proficiency in touch typing to boost your typing speed and accuracy Develop comprehensive Microsoft Excel skills for data organisation, analysis, and presentation Gain a thorough understanding of virtual assistant and personal assistant duties Learn effective communication and organisational skills to excel in a client-facing role Why Choose Us? Get a Free CPD Accredited Certificate upon completion of this course Get a free student ID card with this Training program (£10 postal charge will be applicable for international delivery) This course is affordable and simple to understand This course is entirely online, interactive lesson with voiceover audio Get Lifetime access to this course materials This course comes with 24/7 tutor support Start your learning journey straight away! Moreover, this diploma offers learners the opportunity to acquire skills that are highly valued in the field of Virtual Assistant. With this Certification, graduates are better positioned to pursue career advancement and higher responsibilities within the Virtual Assistant setting. The skills and knowledge gained from this course will enable learners to make meaningful contributions to Virtual Assistant-related fields, impacting their Virtual Assistant experiences and long-term development. Course Curriculum Course 01: Virtual Assistant at QLS Level 2 Module 01: Introduction Module 02: Different Types of Virtual Assistants Module 03: Be a Virtual Assistant Module 04: Must-Have Skills for Virtual Assistants Module 05:Essential Tools Module 06: Finding Your Niche Module 07: Get Hired for VA Jobs Module 08: How to Set VA Business Module 09: Admin Support- a Vital Part of VA Module 10: How to Manage Clients Module 11: Working with a Virtual Team Module 12: Data Security Measures Course 02: PA - Personal Assistant Course Module 01: Introduction to Personal Assistant Module 02: Business Telephone Skills Module 03: Representing Your Boss and Company Module 04: Mail Services and Shipping Module 05: Travel Arrangements Module 06: Organising Meeting and Conferences Module 07: Time Management Module 08: Record Keeping and Filing Systems Module 09: Business Writing Skills Module 10:Organisational Skills Course 03: Data Entry Administrator at QLS Level 3 Module 01: Making Data Entry Jobs Easier Module 02: Getting Started With Microsoft Office Excel 2016 Module 03: Performing Calculations Module 04: Modifying A Worksheet Module 05: Formatting A Worksheet Module 06: Printing Workbooks Module 07: Managing Workbooks Course 04: Certificate in Touch Typing Module 01: Introduction Module 02: How To Set Up Your Computer Module 03: How To Type The Letters F And J Module 04: How To Type The Letters D And K Module 05: How To Type The Letters S And L Module 06: How To Type The Letter A And ; (Semicolon) Module 07: How To Type The Letters E And I Module 08: How To Type The Letters R And U Module 09: How To Type The Letters T And O Module 10: How To Type CAPITAL Letters Module 11: How To Type The Letter C And , (Comma) Module 12: How To Type The Letters G And H Module 13: How To Type The Letters N And V Module 14: How To Type The Letters W And M Module 15: How To Type The Letters Q And P Module 16: How To Type The Letters B And Y Module 17: How To Type The Letters Z And X Module 18: How To Type Colon And Semicolon Module 19: How To Type Full Stop And Comma Module 20: How To Type Question Mark And Exclamation Mark Module 21: How To Type Dash, Parentheses And Quotation Marks Course 05: Microsoft Excel - Beginner, Intermediate & Advanced Unit 01: Excel From A-Z Course Introduction Unit 02: Getting Started With Excel Unit 03: Values, Referencing And Formulas Unit 04: Intro To Excel Functions Unit 05: Adjusting Excel Worksheets Unit 06: Visually Pleasing Cell Formatting Unit 07: How To Insert Images And Shapes! Unit 08: Visualize Data With Charts Unit 09: Excel's Printing Options Unit 10: Benefits Of Using Excel Templates Unit 11: Working With Excel Datasets Unit 12: Excel Database Functions Unit 13: Excel Data Validation Unit 14: Excel PivotTables Unit 15: Excel's PowerPivot Add-In Unit 16: Excel's Conditional Functions Unit 17: Excel's Lookup Function Unit 18: Text Based Functions In Excel Unit 19: Auditing Formulas And Views In Excel Unit 20: Excel's 'What If?' Tools Unit 21: Welcome To Excel VBA Unit 22: The VBA Language Unit 23: Writing VBA Code Unit 24: Important VBA Tools And Logic Unit 25: Excel VBA Lopps Unit 26: Triggering Macros Unit 27: Excel User Forms Unit 28: Starting A Career In Excel How will I get my Certificate? After successfully completing the course, you will be able to order your Certificates as proof of your achievement. PDF Certificate: Free (Previously, it was £12.99*5 = £65) CPD 160 CPD hours / points Accredited by CPD Quality Standards Who is this course for? Anyone interested in learning more about the topic is advised to take this bundle. This bundle is ideal for: Aspiring virtual assistants Remote work enthusiasts Administrative professionals Career changers Freelancers Requirements You will not need any prior background or expertise to enrol in this course. Career path After completing this bundle, you are to start your career or begin the next phase of your career. Virtual Assistant: £18,000 - £30,000 Data Entry Administrator: £16,000 - £25,000 Personal Assistant: £25,000 - £40,000 Certificates CPD Accredited Digital Certificate Digital certificate - Included Upon passing the Course, you need to order a Digital Certificate for each of the courses inside this bundle as proof of your new skills that are accredited by CPD QS for Free. CPD Accredited Hard Copy Certificate Hard copy certificate - £29.99 Please note that International students have to pay an additional £10 as a shipment fee. Award in Virtual Assistant at QLS Level 2 Hard copy certificate - £79 Please note that International students have to pay an additional £10 as a shipment fee.

Microsoft Excel 2016 (Basic to Advanced)
By Compete High
ð Unleash Your Excel Mastery with 'Microsoft Excel 2016 (Basic to Advanced)' Course! ð Are you tired of spending hours grappling with Excel, only to end up with frustrating and inefficient solutions? Do you dream of becoming the Excel wizard in your workplace, effortlessly creating powerful and efficient solutions? Look no further! Introducing our groundbreaking online course: 'Microsoft Excel 2016 (Basic to Advanced).' ð Why Choose 'Microsoft Excel 2016 (Basic to Advanced)'? â Master Advanced Excel Techniques: Dive deep into the world of Excel with our comprehensive modules that cover everything from advanced formulas and functions to data visualization and analysis. â Practical Real-World Applications: Say goodbye to theoretical lessons! We focus on real-world scenarios, ensuring you can immediately apply your newfound skills to solve complex problems in your professional life. â Build Efficiency: Learn the secrets of crafting efficient and streamlined Excel solutions. From automating repetitive tasks to optimizing complex workflows, you'll become a productivity powerhouse. â Expert-Led Instruction: Our experienced instructors are Excel aficionados with a passion for teaching. Benefit from their wealth of knowledge and insider tips, ensuring you stay ahead of the curve. â Interactive Learning: Engage with hands-on exercises, quizzes, and projects that reinforce your understanding and transform you into a confident Excel pro. â Lifetime Access: Gain unlimited access to the course content, updates, and a supportive community. Your learning journey doesn't end - it evolves. ð What You'll Learn: Advanced Formulas and Functions: Supercharge your spreadsheet skills with complex formulas and functions, unlocking Excel's true potential. Data Visualization Mastery: Transform raw data into visually stunning charts and graphs, making your reports and presentations more impactful. Automation Techniques: Streamline your work by mastering Excel's automation features, saving time and reducing errors. Data Analysis Strategies: Unlock the power of PivotTables, data models, and analysis tools to gain valuable insights from your data. Optimizing Workflows: Learn to design efficient workflows and templates that enhance collaboration and productivity. ð Who Is This Course For? Professionals aiming to boost their Excel proficiency. Entrepreneurs seeking to optimize business processes. Students preparing for a data-driven career. Anyone who wants to stay ahead in today's competitive workplace. Don't miss out on this opportunity to elevate your Excel skills and stand out in the crowd. Join 'Microsoft Excel 2016 (Basic to Advanced)' today and pave the way for a successful and efficient future! Course Curriculum Microsoft Excel 2016 Basic Pre Sell Video 00:00 Lesson 1 - Overview 00:00 Lesson 2 - Interface 00:00 Lesson 3 - File Menu - Part 1 00:00 Lesson 4 - File Menu - Part 2 00:00 Lesson 5 - Home Menu 00:00 Lesson 6 - Insert Menu 00:00 Lesson 7 - Page Layout Menu 00:00 Lesson 8 - Formulas Menu 00:00 Lesson 9 - Data Menu - Part 1 00:00 Lesson 10 - Data Menu - Part 2 00:00 Lesson 11 - Review Menu 00:00 Lesson 12 - View Menu 00:00 Lesson 13 - Templates 00:00 Lesson 14 - Dates 00:00 Lesson 15 - Numbers 00:00 Lesson 16 - Text 00:00 Lesson 17 - B - Calculations-Manual 00:00 Lesson 18 - Calculations 00:00 Lesson 19 - Page Set Up 00:00 Lesson 20 - Print Settings 00:00 Lesson 21 - Conclusion 00:00 Microsoft Excel 2016 Advanced Lesson 1 - Overview 00:00 Lesson 2 - Calculations - Absolute References 00:00 Lesson 3 - Calculations - Relative References 00:00 Lesson 4 - Using Logical Formulas 00:00 Lesson 5 - Using Text Formulas 00:00 Lesson 6 - Using Lookup Formulas 00:00 Lesson 7 - Using Financial Formulas 00:00 Lesson 8 - Using Date and Time Formulas 00:00 Lesson 9 - Sorting Data 00:00 Lesson 10 - Formatting Data into Tables 00:00 Lesson 11 - Using Pivot Tables - Part 1 00:00 Lesson 12 Using Pivot Tables - Part 2 - Design 00:00 Lesson 13 - Formatting Data as Charts 00:00 Lesson 14 - Formatting As Data as Maps 00:00 Lesson 15 - Formatting Data as Formal Reports 00:00 Lesson 16 - Formatting Data for Other Office Documents 00:00 Lesson 17 - Cell Protection and Collaboration 00:00 Lesson 18 - Cell Protection and Collaboration - Part 2 00:00 Lesson 19 - Interface with Google Sheets 00:00 Lesson 20 - Conclusion 00:00

Python for Data Analytics
By Nexus Human
Duration 3 Days 18 CPD hours This course is intended for This course is aimed at anyone who wants to harness the power of data analytics in their organization including: Business Analysts, Data Analysts, Reporting and BI professionals Analytics professionals and Data Scientists who would like to learn Python Overview This course teaches delegates with no prior programming or data analytics experience how to perform data manipulation, data analysis and data visualization in Python. Mastery of these techniques and how to apply them to business problems will allow delegates to immediately add value in their workplace by extracting valuable insight from company data to allow better, data-driven decisions. Outcome: After attending this course, delegates will: Be able to write effective Python code Know how to access their data from a variety of sources using Python Know how to identify and fix data quality using Python Know how to manipulate data to create analysis ready data Know how to analyze and visualize data to drive data driven decisioning across your organization Becoming a world class data analytics practitioner requires mastery of the most sophisticated data analytics tools. These programming languages are some of the most powerful and flexible tools in the data analytics toolkit. From business questions to data analytics, and beyond For data analytics tasks to affect business decisions they must be driven by a business question. This section will formally outline how to move an analytics project through key phases of development from business question to business solution. Delegates will be able: to describe and understand the general analytics process. to describe and understand the different types of analytics can be used to derive data driven solutions to business to apply that knowledge to their business context Basic Python Programming Conventions This section will cover the basics of writing R programs. Topics covered will include: What is Python? Using Anaconda Writing Python programs Expressions and objects Functions and arguments Basic Python programming conventions Data Structures in Python This section will look at the basic data structures that Python uses and accessing data in Python. Topics covered will include: Vectors Arrays and matrices Factors Lists Data frames Loading .csv files into Python Connecting to External Data This section will look at loading data from other sources into Python. Topics covered will include: Loading .csv files into a pandas data frame Connecting to and loading data from a database into a panda data frame Data Manipulation in Python This section will look at how Python can be used to perform data manipulation operations to prepare datasets for analytics projects. Topics covered will include: Filtering data Deriving new fields Aggregating data Joining data sources Connecting to external data sources Descriptive Analytics and Basic Reporting in Python This section will explain how Python can be used to perform basic descriptive. Topics covered will include: Summary statistics Grouped summary statistics Using descriptive analytics to assess data quality Using descriptive analytics to created business report Using descriptive analytics to conduct exploratory analysis Statistical Analysis in Python This section will explain how Python can be used to created more interesting statistical analysis. Topics covered will include: Significance tests Correlation Linear regressions Using statistical output to create better business decisions. Data Visualisation in Python This section will explain how Python can be used to create effective charts and visualizations. Topics covered will include: Creating different chart types such as bar charts, box plots, histograms and line plots Formatting charts Best Practices Hints and Tips This section will go through some best practice considerations that should be adopted of you are applying Python in a business context.

Preparing for the Professional Data Engineer Examination
By Nexus Human
Duration 1 Days 6 CPD hours This course is intended for This course is intended for the following participants:Cloud professionals interested in taking the Data Engineer certification exam.Data engineering professionals interested in taking the Data Engineer certification exam. Overview This course teaches participants the following skills: Position the Professional Data Engineer Certification Provide information, tips, and advice on taking the exam Review the sample case studies Review each section of the exam covering highest-level concepts sufficient to build confidence in what is known by the candidate and indicate skill gaps/areas of study if not known by the candidate Connect candidates to appropriate target learning This course will help prospective candidates plan their preparation for the Professional Data Engineer exam. The session will cover the structure and format of the examination, as well as its relationship to other Google Cloud certifications. Through lectures, quizzes, and discussions, candidates will familiarize themselves with the domain covered by the examination, to help them devise a preparation strategy. Rehearse useful skills including exam question reasoning and case comprehension. Tips and review of topics from the Data Engineering curriculum. Understanding the Professional Data Engineer Certification Position the Professional Data Engineer certification among the offerings Distinguish between Associate and Professional Provide guidance between Professional Data Engineer and Associate Cloud Engineer Describe how the exam is administered and the exam rules Provide general advice about taking the exam Sample Case Studies for the Professional Data Engineer Exam Flowlogistic MJTelco Designing and Building (Review and preparation tips) Designing data processing systems Designing flexible data representations Designing data pipelines Designing data processing infrastructure Build and maintain data structures and databases Building and maintaining flexible data representations Building and maintaining pipelines Building and maintaining processing infrastructure Analyzing and Modeling (Review and preparation tips) Analyze data and enable machine learning Analyzing data Machine learning Machine learning model deployment Model business processes for analysis and optimization Mapping business requirements to data representations Optimizing data representations, data infrastructure performance and cost Reliability, Policy, and Security (Review and preparation tips) Design for reliability Performing quality control Assessing, troubleshooting, and improving data representation and data processing infrastructure Recovering data Visualize data and advocate policy Building (or selecting) data visualization and reporting tools Advocating policies and publishing data and reports Design for security and compliance Designing secure data infrastructure and processes Designing for legal compliance Resources and next steps Resources for learning more about designing data processing systems, data structures, and databases Resources for learning more about data analysis, machine learning, business process analysis, and optimization Resources for learning more about data visualization and policy Resources for learning more about reliability design Resources for learning more about business process analysis and optimization Resources for learning more about reliability, policies, security, and compliance Additional course details: Nexus Humans Preparing for the Professional Data Engineer Examination training program is a workshop that presents an invigorating mix of sessions, lessons, and masterclasses meticulously crafted to propel your learning expedition forward. This immersive bootcamp-style experience boasts interactive lectures, hands-on labs, and collaborative hackathons, all strategically designed to fortify fundamental concepts. Guided by seasoned coaches, each session offers priceless insights and practical skills crucial for honing your expertise. Whether you're stepping into the realm of professional skills or a seasoned professional, this comprehensive course ensures you're equipped with the knowledge and prowess necessary for success. While we feel this is the best course for the Preparing for the Professional Data Engineer Examination course and one of our Top 10 we encourage you to read the course outline to make sure it is the right content for you. Additionally, private sessions, closed classes or dedicated events are available both live online and at our training centres in Dublin and London, as well as at your offices anywhere in the UK, Ireland or across EMEA.
Managing & Influencing Stakeholders – 20-in-1 Premium Online Courses Bundle
By Compete High
Effective stakeholder management isn't just about communication—it's about influence, trust, and decision-making. This 20-in-1 bundle gives you the tools to manage people, processes, and projects with clarity and authority. Get trained. Get noticed. Before someone else gets the role. 🔍 Description Influencing stakeholders across departments or clients requires a hybrid of soft skills and operational know-how. This 20-in-1 training collection builds exactly that. With certificates covering leadership, negotiation, disaster response, data analysis, and legal compliance, you’ll come across as a well-rounded professional who understands how to deliver under pressure. Whether you're in operations, admin, legal support, or HR—this bundle adds value to your CV and strengthens your position for management-track roles. And since every course comes with its own certificate, you're not just learning—you’re building a verifiable skillset employers will notice. ❓ FAQ Q: Is this training bundle practical for managers? A: Yes—it’s excellent for aspiring and current managers across industries. Q: What roles does it align with? A: Stakeholder Engagement Officer, Project Support, HR Assistant, Operations Coordinator, Risk Consultant. Q: Is it beginner-friendly? A: Definitely—it suits early professionals and those brushing up their credentials. Q: How long will I have access? A: You’ll get lifetime access to all 20 courses. Q: Will I get certificates? A: Yes—one per completed course.
[vc_row][vc_column][vc_column_text] Description: Improve your competency in Microsoft Office with this Microsoft Excel Complete Course - Beginners, Intermediate, Advanced. Microsoft Excel is the most widely used spreadsheet program in the world. It allows businesses to conduct data analysis, record expenditures and carry out simple to complex maths calculations. Want to master Excel? This complete training course will help you gain the practical skills and knowledge you need to perform everyday data-based tasks faster and more efficiently. This course is designed to help you familiarise with the major functionalities of Excel, with step-by-step guidance. You will start with simple tasks like viewing excel data, working with the interface, using quick analysis and more. At an intermediate skill level, you will learn about macros, forms, slicers, timelines etc. Finally, at an advanced level, you will learn how to create charts, pivot tables, solve formula errors and manage your data more effectively. This online course is the ultimate online guide for learning MS Excel. Certify your skills in this leading office software and gain maximum career progression! Who is the course for? Professionals who want to learn how to use Microsoft Office Excel. People who have a need to analyze and organise large amounts of data. Entry Requirement: This course is available to all learners, of all academic backgrounds. Learners should be aged 16 or over to undertake the qualification. Good understanding of English language, numeracy and ICT are required to attend this course. Assessment: At the end of the course, you will be required to sit an online multiple-choice test. Your test will be assessed automatically and immediately so that you will instantly know whether you have been successful. Before sitting for your final exam, you will have the opportunity to test your proficiency with a mock exam. Certification: After you have successfully passed the test, you will be able to obtain an Accredited Certificate of Achievement. You can however also obtain a Course Completion Certificate following the course completion without sitting for the test. Certificates can be obtained either in hardcopy at the cost of £39 or in PDF format at the cost of £24. PDF certificate's turnaround time is 24 hours, and for the hardcopy certificate, it is 3-9 working days. Why choose us? Affordable, engaging & high-quality e-learning study materials; Tutorial videos/materials from the industry leading experts; Study in a user-friendly, advanced online learning platform; Efficient exam systems for the assessment and instant result; The UK & internationally recognized accredited qualification; Access to course content on mobile, tablet or desktop from anywhere anytime; The benefit of career advancement opportunities; 24/7 student support via email. Career Path: Microsoft Excel Complete Course - Beginners, Intermediate, Advanced is a useful qualification to possess and would be beneficial for any professions or career from any industry you are in such as: Accounting Management consultant Investment Banking Analyst Marketing Engineering Researchering [/vc_column_text][/vc_column][/vc_row] Microsoft Excel - Beginners Module One - Getting Started 00:30:00 Module Two - Opening and Closing Excel 01:00:00 Module Three - Working with the Interface 01:00:00 Module Four - Your First Worksheet 01:00:00 Module Five - Viewing Excel Data 01:00:00 Module Six - Building Formulas 01:00:00 Module Seven - Using Excel Functions 01:00:00 Module Eight - Using Quick Analysis 01:00:00 Module Nine - Formatting Your Data 01:00:00 Module Ten - Using Styles, Themes, and Effects 01:00:00 Module Eleven - Printing and Sharing Your Workbook 01:00:00 Module Twelve - Wrapping Up 01:00:00 Excel for Newbies - Activities 00:00:00 Microsoft Excel - Intermediate Level Module One - Getting Started 00:30:00 Module Two - Working with Permissions and Options 00:30:00 Module Three - Sharing Workbooks 00:30:00 Module Four - Performing Advanced Formula and Function Tasks 00:30:00 Module Five - Working with Array Formulas 01:00:00 Module Six - Working With Macros 00:30:00 Module Seven - Working With Forms 00:30:00 Module Eight - Applying Advanced Chart Features 01:00:00 Module Nine - Working With Slicers and Timelines 00:30:00 Module Ten - Working With Multiple Tables, Relationships and External Data 00:30:00 Module Eleven - Working With PowerView 00:30:00 Module Twelve - Wrapping Up 01:00:00 Activities- Microsoft Excel - Intermediate Level 00:00:00 Microsoft Excel - Advanced Level Module One - Getting Started 01:00:00 Module Two - SmartArt and Objects 01:00:00 Module Three - Auditing 01:00:00 Module Four - Creating Charts 01:00:00 Module Five - Working with Charts 01:30:00 Module Six - Creating Pivot Tables and Pivot Charts 01:00:00 Module Seven - Macros 01:00:00 Module Eight - Solving Formula Errors 01:00:00 Module Nine - Using What If Analysis 01:00:00 Module Ten - Managing Your Data 02:00:00 Module Eleven - Grouping and Outlining Data 01:00:00 Module Twelve - Wrapping Up 00:30:00 Activities-Microsoft Excel - Advanced Level 00:00:00 Mock Exam Mock Exam- Microsoft Excel Complete Course - Beginners, Intermediate, Advanced 00:30:00 Final Exam Final Exam- Microsoft Excel Complete Course - Beginners, Intermediate, Advanced 00:30:00 Certificate and Transcript Order Your Certificates and Transcripts 00:00:00