- Professional Development
- Medicine & Nursing
- Arts & Crafts
- Health & Wellbeing
- Personal Development
META-Health Professional 2025
By META-Health International
Become a META-Health professional with our 6 months intensive training! Do you want to learn the scientific background of body-mind-interactions and how to integrate this knowledge in your practical work with your clients? This course contains both self-study and live training in online classes and covers the META-Health Level 1 and 2 material. It will take 6 months including 24 live sessions, 2 hours each, mainly in a weekly rhythm. You will get preparatory videos, reading material and tasks that help to understand and integrate the content, while the group sessions focus on demonstrations, discusion of the material, and practical exercises for you. All the time, our trainers and tutors will support you and we’ll be a learning family with an active chatgroup. Altogether you should reckon approximately 5 hours per week.

Diploma in Education and Training - Level 5 (Fast-Track mode)
(2)By London School Of Business And Research
The objective of this fast track Level 5 Diploma in Education and Training qualification (accredited by OTHM) is intended to develop learners' understanding of policy, management theory and practice in education. This qualification provides learners with an opportunity to engage with the challenges facing professionals and policy makers in their own country. This fast track Level 5 Diploma in Education and Training qualification will provide you with the knowledge that underpins the ability to work as an effective manager in the education sector. It combine both theoretical and practical knowledge in the education profession and will develop and enhance your knowledge and skills in the areas of leading change, effective performance, planning and accountability, development and team leadership. Learners will be able to work in a variety of roles within education administration and/or management. Diploma in Education and Training - Level 5 (fast track) Key Highlights of this fast track Level 5 Diploma in Education and Training qualification are: Program Duration: 6 Months (Regular mode also available) Program Credits: 120 Credits Designed for working Professionals Format: Online No Written Exam. The Assessment is done via Submission of Assignment Tutor Assist available Dedicated Student Success Manager Timely Doubt Resolution Regular Networking Events with Industry Professionals Become eligible to gain direct entry into relevant Master's degree programme LSBR Alumni Status No Cost EMI Option The OTHM Level 5 Diploma in Education and Training is approved and regulated by Ofqual (Office of Qualifications and Examinations Regulation). The Education Training Foundation has approved the OTHM Level 5 Diploma in Education and Training for accreditation. Learners successfully completing this qualification will be eligible to progress to the status of Qualified Teacher Learning and Skills (QTLS). This is conferred through a separate and subsequent process called professional formation and is administered by the Society for Education and Training (SET) which is the professional body for those working as teachers and trainers in the sector. Who is this course for? Working Professionals A-Level / Level 4 / Year 1 of a three-year UK Bachelor's degree holders or learners who are looking for Career Progression A formal undergraduate qualification leading to award of degrees in future. Career path Learners successfully completing this qualification, will be eligible to progress to the status of Qualified Teacher Learning and Skills (QTLS). This is conferred through a separate and subsequent process called professional formation and is administered by the Society for Education and Training (SET) which is the professional body for those working as teachers and trainers in the sector.

IWFM Level 4 Diploma in Facilities Management
By The Business School (UK) Ltd
The Level 4 Certificate gives a broad understanding of the professional and provides the skills needed to complete complex, non-routine tasks within workplace and facilities management. It's for you if you work at an operational management level or if you are aspiring to these roles and want to stretch and develop your knowledge and capability.

Power BI Data Analyst (PL300)
By Online Productivity Training
OVERVIEW This official Microsoft Power BI training course will teach you how to connect to data from many sources, clean and transform it using Power Query, create a data model consisting of multiple tables connected with relationships and build visualisations and reports to show the patterns in the data. The course will explore formulas created using the DAX language, including the use of advanced date intelligence calculations. Additional visualisation features including interactivity between the elements of a report page are covered as well as parameters and row-level security, which allows a report to be tailored according to who is viewing it. The course will also show how to publish reports and dashboards to a workspace on the Power BI Service. COURSE BENEFITS: Learn how to clean, transform, and load data from many sources Use database queries in Power Query to combine tables using append and merge Create and manage a data model in Power BI consisting of multiple tables connected with relationships Build Measures and other calculations in the DAX language to plot in reports Manage advanced time calculations using date tables Optimise report calculations using the Performance Analyzer Manage and share report assets to the Power BI Service Prepare for the official Microsoft PL-300 exam using Microsoft Official Courseware WHO IS THE COURSE FOR? Data Analysts with little or no experience of Power BI who wish to upgrade their knowledge to include Business Intelligence Management Consultants who need to conduct rapid analysis of their clients’ data to answer specific business questions Analysts who need to upgrade their organisation from a simple Excel or SQL-based management reporting system to a dynamic BI system Data Analysts who wish to develop organisation-wide reporting in the form of web reports or phone apps Marketers in data-intensive organisations who wish to build visually appealing, dynamic charts for their stakeholders to use COURSE OUTLINE Module 1 Getting Started With Microsoft Data Analytics Data analytics and Microsoft Getting Started with Power BI Module 2 Get Data In Power BI Get data from various data sources Optimize performance Resolve data errors Lab: Prepare Data in Power BI Desktop Module 3 Clean, Transform And Load Data In Power BI Data shaping Data profiling Enhance the data structure Lab: Load Data in Power BI Desktop Module 4 Design A Data Model In Power BI Introduction to data modelling Working with Tables Dimensions and Hierarchies Lab: Model Data in Power BI Desktop Module 5 Create Model Calculations Using DAX In Power BI Introduction to DAX Real-time Dashboards Advanced DAX Lab 1: Create DAX Calculations in Power BI Desktop, Part 1 Lab 2: Create DAX Calculations in Power BI Desktop, Part 2 Module 6 Optimize Model Performance Optimize the data model for performance Optimize DirectQuery models Module 7 Create Reports Design a Report Enhance the Report Lab 1: Design a Report in Power BI Desktop, Part 1 Lab 2: Design a Report in Power BI Desktop, Part 2 Module 8 Create Dashboards Create a Dashboard Real-time Dashboards Enhance a Dashboard Lab: Create a Power BI Dashboard Module 9 Perform Advanced Analytics Advanced analytics Data Insights through AI Visuals Lab: Perform Data Analysis in Power BI Desktop Module 10 Create And Manage Workspaces Creating Workspaces Sharing and managing assets Module 11 Manage Datasets In Power BI Parameters Datasets Module 12 Row-Level Security Security in Power BI Lab: Enforce Row-Level Security
Microsoft Project Orange Belt 2016: Virtual In-House Training
By IIL Europe Ltd
Microsoft Project Orange Belt® 2016: Virtual In-House Training This workshop gives participants a full insight into creating effective schedules using Microsoft® Project 2016, allowing you to estimate, coordinate, budget, staff, and control projects and support other users. This workshop gives participants a full insight into creating effective schedules using Microsoft® Project 2016, allowing you to estimate, coordinate, budget, staff, and control projects and support other users. This workshop provides the eBook Dynamic Scheduling with Microsoft® Project 2013, and is kept up to date with the framework of knowledge outlined by the Project Management Institute's PMBOK® Guide and the Practice Standard for Scheduling. What you Will Learn You'll learn how to: Understand what's new in Project 2016 Explain where Project 2016 fits in the Microsoft® EPM solution Initialize Project 2016 to start project planning Create a well-formed project schedule Understand task types and the schedule formula Assign resources and costs to tasks Analyze resource utilization and optimize the schedule Set a baseline and track progress Create and manage project reports Customize views and fields Apply Earned Value Management Understand the basics of managing multiple projects Getting Started Introductions Course structure Course goals and objectives Concepts of Project Management Getting Started with Project 2016 Project 2016: What's New and General Overview Setting Up a New Project Schedule (templates, options, save, etc.) Setting the Project Calendar Entering Tasks The planning processes Importing tasks (Word, Excel, SharePoint) Synchronizing with SharePoint Tasks List Creating and managing the WBS (include tasks, manually scheduled tasks, summary tasks, milestones, and custom WBS coding) Entering Estimates Tendencies in estimating The rolling wave approach Entering duration and work estimates Types of tasks Entering Dependencies The principle of dynamic scheduling Choosing the right Type of dependency Entering dependencies in Project 2016 Different applications of dependencies Entering Deadlines, Constraints, and Task Calendars Use of deadlines and constraints Entering deadlines and constraints in Project 2016 Entering Resources and Costs Types of resources Entering resources in Project 2016 Calendars and resources Entering costs in Project 2016 Entering Assignments Assignments in a schedule Assignments and task types Entering assignments in Project 2016 Assignments, budgets, and costs Optimizing the Schedule The critical path method (CPM) and the resource critical path (RCP) Resource leveling Optimizing time, cost, and resources in Project 2016 Updating the Schedule The baseline Updating strategies and situations Prepare the status and forecast report in Project 2016 Reporting Using reports Using Visual Reports Formatting and printing in Project 2016 Customizing fields in Project 2016 Earned Value Management (EVM) Overview of EVM Applying EVM with Project 2016 Evaluating the Project Evaluating the project performance Project benefits and results Templates for future projects Summary and Next steps Tools and checklist Best practices checklist Certification options

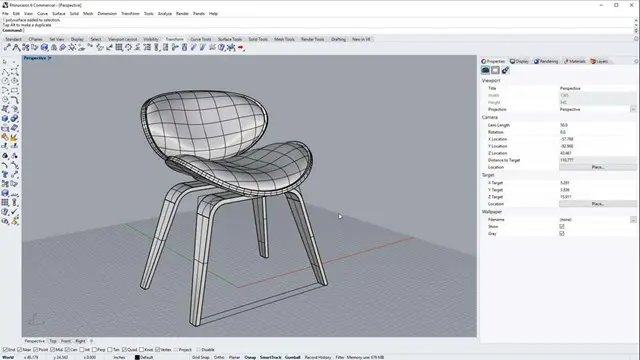
FURNITURE DESIGN TRAINING
By Real Animation Works
Furniture design face to face training customised and bespoke.
Microsoft Project Orange Belt 2013: Virtual In-House Training
By IIL Europe Ltd
Microsoft Project Orange Belt® 2013: Virtual In-House Training This workshop gives participants a full insight into creating effective schedules using Microsoft® Project 2013, allowing you to estimate, coordinate, budget, staff, and control projects and support other users. This workshop gives participants a full insight into creating effective schedules using Microsoft® Project 2013, allowing you to estimate, coordinate, budget, staff, and control projects and support other users. This workshop provides the eBook Dynamic Scheduling with Microsoft® Project 2013, and is kept up to date with the framework of knowledge outlined by the Project Management Institute's PMBOK® Guide and the Practice Standard for Scheduling. What you Will Learn You'll learn how to: Understand what's new in Project 2013 Explain where Project 2013 fits in the Microsoft® EPM solution Initialize Project 2013 to start project planning Create a well-formed project schedule Understand task types and the schedule formula Assign resources and costs to tasks Analyze resource utilization and optimize the schedule Set a baseline and track progress Create and manage project reports Customize views and fields Apply Earned Value Management Understand the basics of managing multiple projects Getting Started Introductions Course structure Course goals and objectives Enterprise Project Management Concepts and Framework Getting Started with Project 2013 Project 2013: What's New and General Overview Setting Up a New Project Schedule (templates, options, save, etc.) Setting the Project Calendar Entering Tasks The Planning Processes Importing Tasks (Word, Excel, SharePoint) Synchronizing with SharePoint Tasks List Creating and managing the WBS (include tasks, manually scheduled tasks, summary tasks and milestones, as well as custom WBS coding) Entering Estimates Tendencies in Estimating The Rolling Wave Approach Entering Duration and Work Estimates Types of Tasks Entering Dependencies The Principle of Dynamic Scheduling Choosing the Right Type of Dependency Entering Dependencies in Project 2013 Different Applications of Dependencies Entering Deadlines, Constraints, and Task Calendars Use of Deadlines and Constraints Entering Deadlines and Constraints in Project 2013 Entering Resources and Costs Types of Resources Entering Resources in Project 2013 Calendars and Resources Entering Costs in Project 2013 Entering Assignments Assignments in a Schedule Assignments and Task Types Entering Assignments in Project 2013 Assignments, Budgets, and Costs Optimizing the Schedule The Critical Path Method and the Resource Critical Path Resource Leveling Optimizing Time, Cost, and Resources in Project 2013 Updating the Schedule The Baseline Updating Strategies and Situations Prepare the Status and Forecast Report in Project 2013 Reporting Using Reports Using Visual Reports Formatting and Printing in Project 2013 Customizing Fields in Project 2013 Earned Value Management (EVM) Overview of EVM Applying EVM with Project 2013 Evaluating the Project Evaluating the Project Performance Project Benefits and Results Templates for Future Projects Summary Tools and Checklist Best Practices Checklist Consolidated Schedules Creating Consolidated Schedules Using a Resource Pool Links across Projects Solving common problems Analyzing the Critical Path across Projects
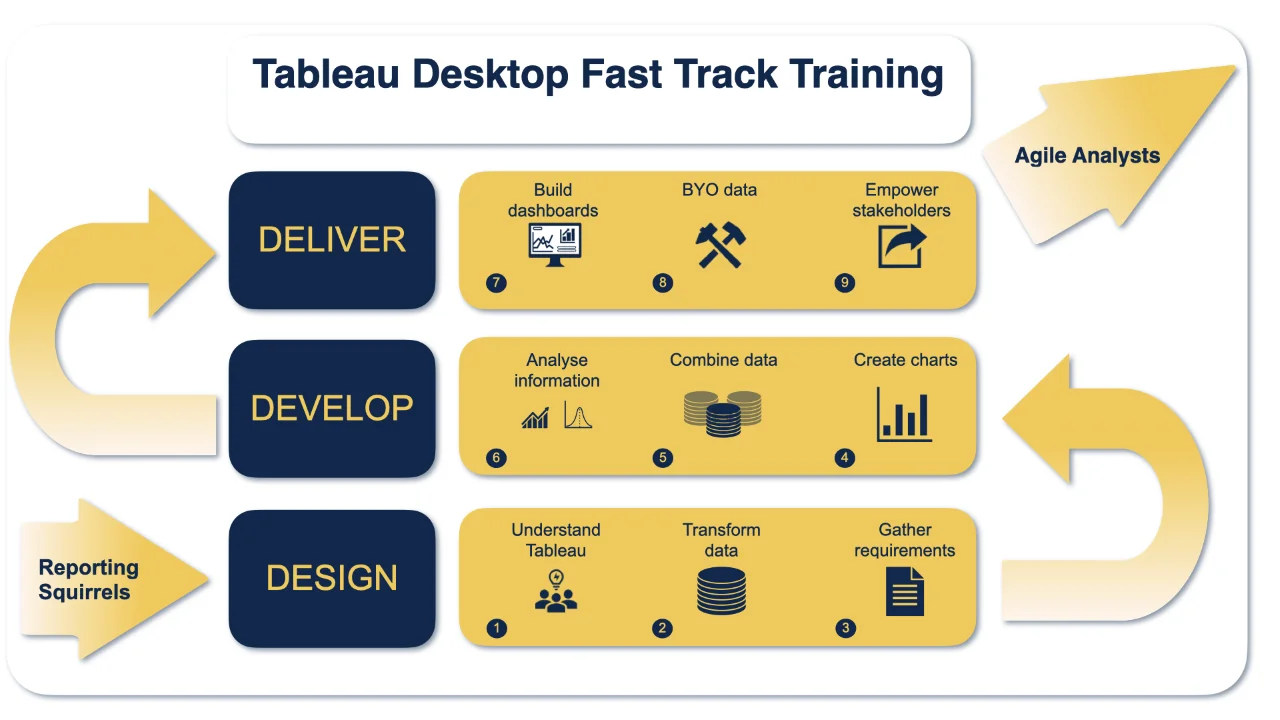
Tableau Training On Tap - Fast Track
By Tableau Training Uk
Tableau is an intuitive and simple tool to learn. This Tableau training course is a jumpstart to getting report writers and analysts who are self-taught or have no previous knowledge to being productive. It covers everything from connecting to data, through to creating interactive dashboards with a range of visualisations in three days. Having a quick turnaround from starting to use Tableau, to getting real, actionable insights means that you get a swift return on your investment. At the end of this course, you will be able to communicate insights more effectively, enabling your organisation to make better decisions, quickly. This accelerated approach is key to getting engagement from within your organisation so everyone can immediately see and feel the impact of the data and insights you create. Our Tableau Desktop Fast Track course combines all of our Foundation (Fundamentals) and Analyst (Intermediate) content into a 3 day live online course with added access to online bonus content of 3 additional modules. Gathering Requirements, Bring Your Own Data and Engaging Users. What do you get? This course is delivered live virtually and has all material provided through our online portal, together with email support and live coaching sessions. The full program includes all of the following elements: 3 days of live and interactive instructor-led sessions delivered by an expert Tableau Trainer 6 weeks access to our live coaching program delivered by expert Tableau coaches 50+ practical exercises to practice what you learn 12 months access to video’s that walk you through the theory and exercise solutions Practical advice, tools and resources for using Tableau in the real world The three additional online modules provide:Clarity on the approach to gathering dashboard requirements in a way that can be translated into dashboard designs.An agile and iterative development process that delivers products that meet user needs more quickly and effectively.An understanding of how end users will interact with dashboards to ensure that designers deliver actionable results. THE SYLLABUS PHASE 1: DESIGN MODULE 1: UNDERSTAND TABLEAU What is possible How does Tableau deal with data Know your way around Review of Type Conversions How do we format charts Dashboard basics – My first Dashboard MODULE 2: TRANSFORM DATA Connecting to and setting up data in Tableau Modifying data attributes How Do I Structure my Data – Groups & Hierarchies, Visual Groups How Tableau Deals with Dates – Using Discrete and Continuous Dates, Custom Dates How do I create calculated fields and why? – Creating Calculated Fields, Types of calculated fields, Row Level v Aggregations, Aggregating dimensions in calculations, Changing the Level of Detail (LOD) of calculations – What, Why, How MODULE 3: GATHER REQUIREMENTS(ONLINE CONTENT ONLY) Brainstorm and assess possible priorities Pitfalls to avoid Gather requirements PHASE 2: DEVELOP MODULE 4: CREATE CHARTS Charts that Compare Multiple Measures – Measure Names and Measure Values, Shared Axis Charts, Dual Axis Charts, Scatter Plots Showing progress over time Creating Tables – Creating Tables, Highlight Tables, Heat Maps Showing Relational & Proportional Data – Pie Charts, Donut Charts, Tree Maps Making things dynamic with parameters MODULE 5: COMBINE DATA Relationships Joining Tables – Join Types, Joining tables within the same database, cross database joins, join calculations Blending – How to create a blend with common fields, Custom defined Field relationships and mismatched element names, Calculated fields in blended data sources Unions – Manual Unions and mismatched columns, Wildcard unions Data Extracts – Creating & Editing Data extracts MODULE 6: ANALYSE INFORMATION Table Calculations Sets, Reference Lines, Trends and Forecasting Answering spatial questions – Mapping, Creating a choropleth (filled) map, Using your own images for spatial analysis, Mapping with spatial files Advanced charts Bar in Bar charts Bullet graphs Creating Bins and Histograms Creating a Box & Whisker plot Viz in Tooltips PHASE 3: DESIGN MODULE 7: BUILD DASHBOARDS Using the Dashboard Interface Device layouts Dashboard Actions – Set actions, Parameter actions Viz in Tooltips for Dashboards Dashboard containers – Horizontal & Vertical containers, Hidden containers Navigate between dashboards Telling data driven stories MODULE 8: BRING YOUR OWN DATA Design Best Practices & Resources Wireframe templates Questions Process Start building and testing MODULE 9: EMPOWER STAKEHOLDERS What is Tableau Server Publishing & permissions How can your users engage with content The Tableau ecosystem Review your progress Your next steps HOW MUCH OF YOUR TIME WILL THIS TAKE? Delegates are also provided 6 weeks access to our Tableau Coaching. We run Live Q&A sessions from 4pm-5pm on a Monday (Connecting to Data and Calculated Fields), 2pm-3pm Friday (Creating Charts) & 4pm-5pm Friday (Dashboard Design). The coaching helps delegates to transition from the theory of using Tableau to its practical use. We’d be expecting them to apply the exercises you’ll be doing during the course, onto your own data after the course. In our experience, this is the best way to increase both understanding and long term memory retention. The live coaching also acts as a troubleshooting platform for any practical issues that delegates need to overcome in the real world. Delegates also have 12 months access to all of the training material covered in the course in the form of an online portal (this includes theory videos, exercise solution videos, exercise materials and even quizzes). We have a growing LinkedIn community that delegates are encouraged to join and participate in. We regularly post useful blog posts and additional training that will enhance the Tableau journey and understanding. We help teams using Tableau to transform in the following ways : From a disjointed understanding of Tableau – To being familiar with Tableau terminology and capability From ad-hoc data uploads and error prone calculations – To reusable data connections and robust metrics From disjointed stakeholder questions – To clear and concise requirements that lead to decision making From being unsure how difficult Tableau will be to learn – To being able to develop standard charts and tables in Tableau with dynamic reporting capabilities From manually combining data for each analytical task – To dynamically combining data from multiple tables for analysis From being unsure how to answer analytical questions and what options there are – To being equipped with multiple actionable, dynamic, analytical use cases From not knowing Why, When and How to create Dashboards or Story’s – To being able to combine analysis to answer complex questions and tell data driven stories From using demo data theory – To Delivering value [Answering questions] on their own data From spending lots of time answering colleagues ad-hoc (data) questions – To empowering stakeholders in answering ad-hoc queries and reducing the time to analyse and steer the business

ICA Advanced Certificate in Managing Sanctions Risk
By International Compliance Association
ICA Advanced Certificate in Managing Sanctions Risk Sanctions are a key tool in the armoury of the global fight against financial crime. Understanding sanctions remains a complex yet fascinating topic and is crucial for the development of well-rounded strategy in combating financial crime. The ICA Advanced Certificate in Managing Sanctions Risk explores the intricacies and challenges of meeting sanctions obligations. You will learn about the latest sanctions challenges and best practice and you will review case studies so you understand the risks sanctions present to firms and the frameworks used to manage these risks. The course will also investigate key areas of sanctions controls such as sanctions screening, managing alerts and sanctions evasion typologies. This course will enable you to: Understand latest sanctions challenges Learn sanctions best practice Review case studies, so you understand the risks sanctions present to firms and the frameworks used to manage these risks Investigate key areas of sanctions controls such as sanctions screening, managing alerts and sanctions evasion typologies. Benefits of studying with ICA: Flexible learning solutions that are suited to you Our learner-centric approach means that you will gain relevant practical and academic skills and knowledge that can be used in your current role Improve your career options by undertaking a globally recognised qualification that hiring managers look for as part of their hiring criteria Many students have stated that they have received a promotion and/or pay rise as a direct result of gaining their qualification The qualifications ensure that you are enabled to develop strategies to help manage and prevent risk within your firm, thus making you an invaluable asset within the current climate This course is awarded in association with Alliance Manchester Business School, the University of Manchester. Students who successfully complete the assessment criteria for this course will be awarded the ICA Advanced Certificate in Managing Sanctions Risk and will be able to use designation - (Adv.Cert(Sanctions). What will you learn? Global sanctions architecture - Political, Legal and Implementation context The international context Transparency, control and ownership Developing the control framework Sanctions lifting and roll back Identifying higher risk jurisdictions and activities