- Professional Development
- Medicine & Nursing
- Arts & Crafts
- Health & Wellbeing
- Personal Development
Excel - introduction (In-House)
By The In House Training Company
This one-day workshop is designed to give you an awareness of the fundamentals of Microsoft Excel and, in particular, to give you the confidence needed to efficiently create, edit and manage spreadsheets. This course will help participants: Create tables Use functions Manage rows and columns Write formulas Manage sheets Use content formats Handle larger tables Create reports and charts 1 Creating a table Creating an Excel table from scratch Wrapping text in cells Speeding up data entry using AutoFill Sorting columns 2 Inserting function Inserting function calculators Using AutoSum to sum numbers Statistical calculations AVERAGE, MAX and MIN 3 Table rows and columns Inserting and deleting rows and columns Adjusting multiple column widths and row heights Hiding and unhiding rows and columns 4 Formula writing The basics of formula writing Understanding mathematical symbols Using multiple mathematical symbols in a formula When to use brackets Troubleshooting calculation errors 5 Managing sheets Inserting, renaming, moving and deleting sheets Copying a worksheet to another file Copying a table to another sheet 6 Managing content formats Applying data formats Managing number formats Controlling formats with the Format Painter 7 Managing larger tables Applying freeze panes to lock tables when scrolling Sorting on multiple columns Using filters to extract table information 8 Creating and modifying charts Creating a pie chart Creating a column chart Inserting chart titles and data labels Controlling chart formatting Changing chart types 9 Printing Previewing and printing tables and charts Modifying page orientation Adjusting print margins Printing a selection 10 Calculating with absolute reference The difference between a relative and absolute formula Changing a relative formula to an absolute Using $ signs to lock cells when copying formulas 11 Pivot tables Create a pivot table report Insert a pivot chart into a report

Excel Charting Specialist
By Underscore Group
Look at the in depth features of charts and some specialist tools to make your charts come to life. Course overview Duration: 1 day (6.5 hours) Our Excel Charting Specialist course examines how to unlock the full potential of Charts in Excel. It investigates the useful tools needed for creating bespoke Charts, allowing you to creatively present data more visually. By the end of the course, you will have an awareness of the tools used for creating more advanced Charts and will be able to create your own Dynamic Charts. The course is designed for existing users of Excel who are looking at more advanced ways to visualise data in Excel using Charts. Objectives By the end of the course you will be able to: Create and Amend Charts Format multiple areas of a Chart Use a Combo Chart Apply Conditional Formatting to a Chart Create Dynamic Charts Work with Custom Formatting Create an Advanced Dynamic Chart Content Creating and amending charts Creating Simple Charts Using the Chart Design tab Adding Chart Elements Changing the type of Chart Formatting charts Format Chart Area Format Data Series Format Data Point Format Axis Working with combo charts Adding additional data to a Chart Customising Chart types Creating Clustered Column/line Charts Applying conditional formatting on charts Using IF Statements Highlighting Max/Min Data points in Charts Using Series Overlap Dynamic charts Creating dynamic Target vs Actual Charts Introducing the NA function Hiding data used for Charts Custom formatting charts Formatting Data Labels Customising number formats Using Trend Arrows to show changes Editing Format Code Advanced dynamic charts Pivot Chart rules Creating a Pivot Chart Working with your Pivot Chart Creating calculations Combining all elements to create an Advanced Chart Using Error Bars to create a line Adding a scroll bar and linking with data
Functional Skills IT with Microsoft Excel, IoT & ICT Training - 8 Courses Bundle
By NextGen Learning
Are you ready to embark on an enlightening journey of wisdom with the Functional Skills IT with Microsoft Excel, IoT & ICT Training bundle, and pave your way to an enriched personal and professional future? If so, then Step into a world of knowledge with our bundle - Functional Skills IT with Microsoft Excel, IoT & ICT Training. Delve into eight immersive CPD Accredited courses, each a simple course: Course 1: IT Administration and Networking Course 2: Microsoft Excel Course Course 3: ICT: Information and Communication Technology Course 4: Start an IT Asset Department Course 5: CompTIA IT Fundamentals ITF+ (FCO-U61) Course 6: Recruitment: IT Basics for IT Recruiters Course 7: Web Application Penetration Testing Course Course 8: Internet of Things Traverse the vast landscapes of theory, unlocking new dimensions of understanding at every turn. Let the Functional Skills IT with Microsoft Excel, IoT & ICT Training bundle illuminate your path to wisdom. The Functional Skills IT with Microsoft Excel, IoT & ICT Training bundle offers a comprehensive exploration into a rich tapestry of vast knowledge across eight carefully curated courses. The journey is designed to enhance your understanding and critical thinking skills. Each course within the bundle provides a deep-dive into complex theories, principles, and frameworks, allowing you to delve into the nuances of the subject matter at your own pace. In the framework of the Functional Skills IT with Microsoft Excel, IoT & ICT Training package, you are bestowed with complimentary PDF certificates for all the courses included in this bundle, all without any additional charge. Adorn yourself with the Functional Skills IT with Microsoft Excel, IoT & ICT Training bundle, empowering you to traverse your career trajectory or personal growth journey with self-assurance. Register today and ignite the spark of your professional advancement! So, don't wait further and join the Functional Skills IT with Microsoft Excel, IoT & ICT Training community today and let your voyage of discovery begin! Learning Outcomes: Upon completion of the Functional Skills IT with Microsoft Excel, IoT & ICT Training Bundle, you will be able to: Attain a holistic understanding in the designated areas of study with the Functional Skills IT with Microsoft Excel, IoT & ICT Training bundle. Establish robust bases across each course nestled within the Functional Skills IT with Microsoft Excel, IoT & ICT Training bundle. Decipher intricate concepts through the articulate content of the Functional Skills IT with Microsoft Excel, IoT & ICT Training bundle. Amplify your prowess in interpreting, scrutinising, and implementing theories. Procure the capacity to engage with the course material on an intellectual and profound level. Become proficient in the art of problem-solving across various disciplines. Stepping into the Functional Skills IT with Microsoft Excel, IoT & ICT Training bundle is akin to entering a world overflowing with deep theoretical wisdom. Each course within this distinctive bundle is an individual journey, meticulously crafted to untangle the complex web of theories, principles, and frameworks. Learners are inspired to explore, question, and absorb, thus enhancing their understanding and honing their critical thinking skills. Each course invites a personal and profoundly enlightening interaction with knowledge. The Functional Skills IT with Microsoft Excel, IoT & ICT Training bundle shines in its capacity to cater to a wide range of learning needs and lifestyles. It gives learners the freedom to learn at their own pace, forging a unique path of discovery. More than just an educational journey, the Functional Skills IT with Microsoft Excel, IoT & ICT Training bundle fosters personal growth, enabling learners to skillfully navigate the complexities of the world. The Functional Skills IT with Microsoft Excel, IoT & ICT Training bundle also illuminates the route to a rewarding career. The theoretical insight acquired through this bundle forms a strong foundation for various career opportunities, from academia and research to consultancy and programme management. The profound understanding fostered by the Functional Skills IT with Microsoft Excel, IoT & ICT Training bundle allows learners to make meaningful contributions to their chosen fields. Embark on the Functional Skills IT with Microsoft Excel, IoT & ICT Training journey and let knowledge guide you towards a brighter future. CPD 100 CPD hours / points Accredited by CPD Quality Standards Who is this course for? Individuals keen on deepening their firm understanding in the respective fields. Students pursuing higher education looking for comprehensive theory modules. Professionals seeking to refresh or enhance their knowledge. Anyone with a thirst for knowledge and a passion for continuous learning. Requirements Without any formal requirements, you can delightfully enrol in this Functional Skills IT with Microsoft Excel, IoT & ICT Training Bundle. Career path Armed with the Functional Skills IT with Microsoft Excel, IoT & ICT Training bundle, your professional journey can reach new heights. The comprehensive theoretical knowledge from this bundle can unlock diverse career opportunities across several fields. Whether it's academic research, consultancy, or programme management, this bundle lays a solid groundwork. Certificates CPD Certificate Of Completion Digital certificate - Included 8 Digital Certificates Are Included With This Bundle CPD Quality Standard Hardcopy Certificate (FREE UK Delivery) Hard copy certificate - £9.99 Hardcopy Transcript: £9.99

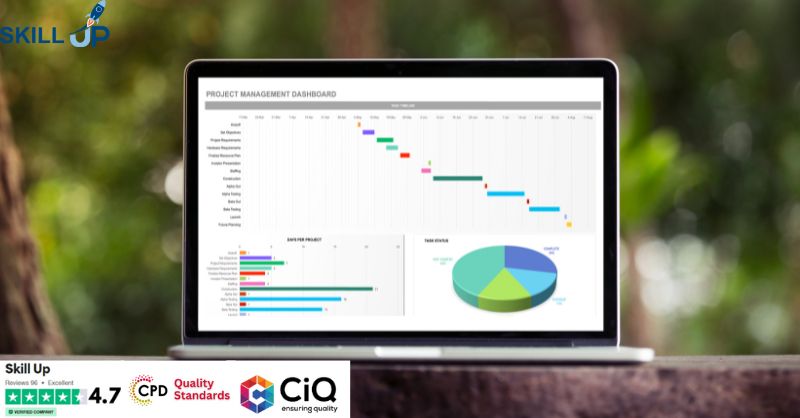
Register on the Excel for Data Analytics today and build the experience, skills and knowledge you need to enhance your professional development and work towards your dream job. Study this course through online learning and take the first steps towards a long-term career. The course consists of a number of easy to digest, in-depth modules, designed to provide you with a detailed, expert level of knowledge. Learn through a mixture of instructional video lessons and online study materials. Receive online tutor support as you study the course, to ensure you are supported every step of the way. Get an e-certificate as proof of your course completion. The Excel for Data Analytics is incredibly great value and allows you to study at your own pace. Access the course modules from any internet-enabled device, including computers, tablet, and smartphones. The course is designed to increase your employability and equip you with everything you need to be a success. Enrol on the now and start learning instantly! What You Get With The Excel for Data Analytics Receive a e-certificate upon successful completion of the course Get taught by experienced, professional instructors Study at a time and pace that suits your learning style Get instant feedback on assessments 24/7 help and advice via email or live chat Get full tutor support on weekdays (Monday to Friday) Course Design The course is delivered through our online learning platform, accessible through any internet-connected device. There are no formal deadlines or teaching schedules, meaning you are free to study the course at your own pace. You are taught through a combination of Video lessons Online study materials Certification Upon successful completion of the course, you will be able to obtain your course completion e-certificate free of cost. Print copy by post is also available at an additional cost of £9.99 and PDF Certificate at £4.99. Who Is This Course For: The course is ideal for those who already work in this sector or are an aspiring professional. This course is designed to enhance your expertise and boost your CV. Learn key skills and gain a professional qualification to prove your newly-acquired knowledge. Requirements: The online training is open to all students and has no formal entry requirements. To study the Excel for Data Analytics, all your need is a passion for learning, a good understanding of English, numeracy, and IT skills. You must also be over the age of 16. Course Content Module 01: Introduction to the World of Data Introduction to the World of Data 01:00:00 Module 02: Basics of Data Analytics Basics of Data Analytics 00:40:00 Module 03: Excel for Data Analytics Excel for Data Analytics 01:20:00 Frequently Asked Questions Are there any prerequisites for taking the course? There are no specific prerequisites for this course, nor are there any formal entry requirements. All you need is an internet connection, a good understanding of English and a passion for learning for this course. Can I access the course at any time, or is there a set schedule? You have the flexibility to access the course at any time that suits your schedule. Our courses are self-paced, allowing you to study at your own pace and convenience. How long will I have access to the course? For this course, you will have access to the course materials for 1 year only. This means you can review the content as often as you like within the year, even after you've completed the course. However, if you buy Lifetime Access for the course, you will be able to access the course for a lifetime. Is there a certificate of completion provided after completing the course? Yes, upon successfully completing the course, you will receive a certificate of completion. This certificate can be a valuable addition to your professional portfolio and can be shared on your various social networks. Can I switch courses or get a refund if I'm not satisfied with the course? We want you to have a positive learning experience. If you're not satisfied with the course, you can request a course transfer or refund within 14 days of the initial purchase. How do I track my progress in the course? Our platform provides tracking tools and progress indicators for each course. You can monitor your progress, completed lessons, and assessments through your learner dashboard for the course. What if I have technical issues or difficulties with the course? If you encounter technical issues or content-related difficulties with the course, our support team is available to assist you. You can reach out to them for prompt resolution.

Excel Advanced Statistical Analysis
By Underscore Group
Use some of the hidden statistical analysis tools within Excel to build complex data models. Course overview Duration: 1 day (6.5 hours) This advanced Excel course looks at some of the statistical analysis tools available and gives examples of when they might be used. This course is aimed at advanced users of Excel who work with statistical data often and have a good knowledge of Maths. Objectives By the end of the course you will be able to: Use Goal Seek Create and view scenarios Use Forecast Sheet Create single and double input data tables Create models using the solver Install and use the Analysis Toolpak Create and use array formulas Use a range of advanced Financial and Statistical Excel functions Content Using what if analysis options Using Goal Seek Creating, saving and viewing scenarios Generating a Forecast sheet Solver Creating models Projecting scenarios with Solver Using data tables Creating single input data tables Creating double input data tables Projecting with data tables Financial functions PMT FV NPV Analysing data with Analysis ToolPak Installing the Analysis Toolpak Generating statistical analysis Visualising data using Histograms Array formulas Using embedded Excel Array formulas Create an Array formula Multi and single cell Array formula Using TRANSPOSE to flip rows or columns Use the FREQUENCY Function Use an array to count unique entries in a range Dynamic arrays Spilling data Using the new dynamic array functions Advance functions in formulas Statistical functions:MEAN, MEDIAN and MODERANKLARGE and SMALLMODPERCENTILE Use the AGGREGATE function to sum data in ranges with errors

Overview In this course you will learn to build a financial model by working in Excel and how to perform sensitivity analysis in Excel. You will also learn the formulas, functions and types of financial analysis to be an Excel power user. By attending this course, you will be able to effectively prepare and build financial models. Objectives Harness Excel's tools within a best practice framework Add flexibility to their models through the use of switches and flexible lookups Work efficiently with large data volumes Model debt effectively Approach modelling for tax, debt, pensions and disposals with confidence Build flexible charts and sensitivity analysis to aid the presentation of results Learn and apply Excel tools useful in financial forecasting Understand and design the layout of a flexible model Forecast financial statements of a public or private company Apply scenario analysis to the forecasted financial statements and prepare charts for data presentation