- Professional Development
- Medicine & Nursing
- Arts & Crafts
- Health & Wellbeing
- Personal Development
PL300 Revision Day (PL300REV)
By Online Productivity Training
OVERVIEW Prerequisites—this is a day of supervised revision for anyone who wishes to take the PL-300 exam so we expect you to have attended a PL-300 course, either taught or on your own, before attending this day of revision. We are happy for attendees to join the course if you have taken the PL-300 with us or with another provider. In the morning we look at questions from the PL-300 exam, grouped by subject area. For each question we show you the correct answer and then explain why that is the correct answer. After lunch everyone tries a practice exam under exam conditions and we finish the day with clarification on the subjects or specific questions that the class is finding hard. The cost of the course includes a free voucher to take the exam, so please don’t buy your own separately. If you do so we cannot reimburse you with the cost of the exam. COURSE BENEFITS: Discover the parts of the course on which to focus most attention Become familiar with the styles and formats of the exam questions Alert yourself to some of the particularly tricky questions Familiarise yourself with the style of the 'case study' question Practice an exam under real exam conditions Get a feel for the time you need to devote to the normal questions and to the case study WHO IS THE COURSE FOR? Power BI report developers who need PL-300 Certification to apply for a job Business Intelligence specialists who wish to enhance their career prospects with a PL-300 Certification Anyone who wishes to maximise their chances of passing the PL-300 Power BI Data Analyst exam COURSE OUTLINE Module 1 Structure Of The Exam Registration for the exam and setup of your workspace The percentage of marks devoted to each subject area Types of questions used in the exam Advised timing for the normal questions and for the case study question Module 2 Individual Exam Question Practice The exam questions are divided into subject areas and for each question… We consider the question and try to answer it We view the answer Where necessary, we look at an in-depth explanation of why that is the correct answer Examine case study questions and how to treat these differently from the normal questions Module 3 Practice Exam Under Exam Conditions Attendees take a practice exam Attendees receive a mark, broken down into subject areas Module 4 Exam Question Practice Focussed On Tricky Areas Together, based on the results of attendees’ exam results we decide which areas on which to focus More practice on individual exam questions using the same style as in Module 2

Effective Presentation Skills: In-House Training
By IIL Europe Ltd
Effective Presentation Skills: In-House Training In today's results-oriented, global working environment, the ability to create and deliver presentations effectively is a necessary skill set for people at all levels of an organization. Regardless of your role, it's important to know how to synthesize your ideas into a coherent and focused narrative, add visuals that support and reinforce your message, and deliver it in a way that resonates with your audience. In this highly interactive course, we will unpack and practice some of the tools and techniques used by top speakers and influencers all over the world. In this engaging two-day course, you will plan, write, refine, practice, and deliver a presentation to the class. Your presentation will be filmed on both days, and you will leave the course with a flash-drive copy of your videos; participants of the virtual classroom workshop should be prepared to present via webcam. In addition to discovering and enhancing your own personal delivery style, you will learn how to create an overarching goal for your presentation and then organize and structure it for maximum impact. You'll gain insight into how to anticipate your audience's needs and tailor the content and delivery in a way that connects with them and sustains their attention and engagement. You will also learn skills that will help you control nervous energy, remain focused on and attuned to your audience, improvise under pressure, deal effectively with questions, and build a compelling call to action. What you will Learn At the end of this program, you will be able to: Construct an effective presentation goal statement, opening, body, and closing that connect with an audience Analyze an audience's needs and style preferences, including relevant DiSC®-related elements Deliver a complete criteria-based presentation that will persuade others Align usage of visuals as well as verbal and non-verbal techniques to maximize the impact of your presentation Getting Started Introductions and social agreements Course structure Course goals and objectives Opening activities Planning and Organizing Video: 'The Art of Misdirection' Setting your presentation goal Writing a goal statement Analyzing your audience Applying the 'reality' test Creating and strengthening supports Structuring your presentation 5 components of an effective opening Presentation body Presentation closing Write your presentation opening Audience Analysis Video: 'How to Tie Your Shoes' Everything DiSC® introduction Audience DiSC® Styles Analyzing your audience Further audience analysis Effective Delivery Delivery challenges: virtual and in-person Keeping your audience engaged Your body as your instrument Verbal / paraverbal elements Body stance and nonverbal communication What are your 'tells?' Controlling nervousness Staying attuned to your audience Responding to questions Review and edit your opening Deliver your opening Visuals and Enriching Elements Using images in your presentation Guidelines for visual composition Using questions to engage your audience The power of the pause Practicing and Applying What You've Learned Preparation Delivery Feedback Opportunity to put into practice the program content and receive a video copy Summary and Next Steps What did we learn and how can we implement this in our work environment? Your personal action plan

ICA Advanced Certificate in Practical Customer Due Diligence (CDD)
By International Compliance Association
ICA Advanced Certificate in Practical Customer Due Diligence (CDD) Course The CDD training course covers best practice in dealing with Customer Due Diligence and working with CDD documentation. Adequate due diligence on new and existing customers has never been so instrumental to protecting a business from reputational, operational, legals and financial risks. Designed for KYC Analysts and professionals working with the CDD process, this course provides a practical qualification in CDD that will help you make clear and informed CDD judgements. In doing so, this course will also improve your ability to identify areas of potential risk for your firm in relation to Customer Due Diligence. Benefits of studying with ICA: Flexible learning solutions that are suited to you Our learner-centric approach means that you will gain relevant practical and academic skills and knowledge that can be used in your current role Improve your career options by undertaking a globally recognised qualification that hiring managers look for as part of their hiring criteria Many students have stated that they have received a promotion and/or pay rise as a direct result of gaining their qualification The qualifications ensure that you are enabled to develop strategies to help manage and prevent risk within your firm, thus making you an invaluable asset within the current climate Students who successfully complete the course will be awarded the ICA Advanced Certificate in Practical Customer Due Diligence and will be entitled to use the designation- Adv.Cert(CDD) This qualification is awarded in association with Alliance Manchester Business School, the University of Manchester. This three workshop training programme will use CDD documents and hands-on learning to cover the following topics: Outcomes and success criteria of KYC Identification and verification Understanding the customer Understanding the relationship Beneficial ownership Understanding the control structure of the entity Customer screening Risk acceptance Enhanced due diligence How will you be assessed? Three hour examination which comprises multiple choice questions and short form written response questions (including a section where you will be provided with a set of CDD documentation and asked to assess the information/respond to questions based upon them.) Pre-reading/exercises/tasks to be completed in advance of virtual workshops, delivered via the online learning platform. Four compulsory virtual classrooms covering key areas and embedding them through discussions and practical exercises (workshops are compulsory as part of the exam is based on the case study used in the workshops). The innovative workshop exercises that use mock CDD documents, genuinely reflecting the practical issues encountered in the CDD environment.
Certified Data Centre Expert (CDCE)
By Nexus Human
Duration 5 Days 30 CPD hours This course is intended for The primary audience for this course is any IT, facilities or data centre professional, who are involved in the design/build, renovation or relocation of a mission-critical data centre. Overview This 5-day course is designed to prepare participants to analyse a given business case and perform technical evaluation for a project plan and a set of designs for the implementation of a mission critical data centre. The course also engages participants in product evaluations and demonstrates how to select equipment and develop equipment test scripts (IET) and integrated performance and validation testing (IPVT). CDCE© builds upon knowledge gained in CDCP and CDCS courses. Participants who pass the exam will join the industry's elite data centre project design experts. CDCE© is the highest level training in the EPI Design and Build training track under the EPI Data Centre Training Framework. Participants must hold a valid CDCS certificate in order to be able to register for the CDCE class. CDCE© is the premier certification for data centre professionals in the data centre design/build and related fields. Data Centre Life Cycle Data centre lifecycle stages and phases Exercise: Stage/Phase/Milestone/Document mapping Design Preparation Creation of a SON ? Statement Of Need Technology review Conceptual sizing How to calculate for computer room space How to calculate facility space How to calculate incoming power Exercise: Conceptual sizing building and power Analysing capacity of existing facility Analysing investment options Site selection Permits and approvals Exercise: Site selection Conceptual design Budget and project timeline Business case preparation Project delivery structure Project management options Project manager and team Design Planning OSRA?Operational Systems Requirement Analysis TFRA?Technical Facilities Requirement Analysis Operations and maintenance review RFP?Request For Proposal process Vendor selection Design Development Project planning Design development PDR ? Preliminary Design Review Equipment selection FDR/V ? Final Design Review/Validation Exercise: Full design validation of power, cooling, floor plans, fire suppression Design freeze and LLTI Creation of construction documents BOM/BOQ ? Bill Of Material/Bill Of Quantity Exercise: Equipment selection Acquire Requirements of purchase orders Shipping terms FWT/FAT ? Factory Witness Test/Factory Acceptance Test Sequencing Incoming goods inspection and handling Asset management Construct Temporary essential services Erection of the building Permanent essential services Building inspection Snag list COF?Certificate Of Fitness Fit-Out Fit-Out Builders cleaning As-Built Drawings Test & Commissioning IET?Individual Equipment Test IPVT/IST?Integrated Performance Verification Test/Integrated Systems Test Common mistakes with IET/IPVT Deep cleaning Exercise: IET/IPVT scripting Hand-Over Facility hand-over requirements and documents PCC?Practical Completion Certificate DLP?Defect Liability Period Defect Management ICT Systems Installation ICT Systems Testing Hand-Over/DLP Expiry FCC?Final Completion Certificate Retirement Reasons and definitions of retirement Building the business case and project plan Sequencing Transfer of site Demolishing of site Legal matters FCC?Final Completion Certificate Exam: Certified Data Centre Expert (CDCE©) The CDCE© exam is in two parts: Part A is a 90-minute closed book exam, with 60 multiple-choice questions. For Part A, the candidate requires a minimum of 45 correct answers to pass the exam. Part B is a 90-minute closed book exam, with 25 open questions. For Part B the candidate needs to obtain a minimum of 75% to pass. Additional course details: Nexus Humans Certified Data Centre Expert (CDCE) training program is a workshop that presents an invigorating mix of sessions, lessons, and masterclasses meticulously crafted to propel your learning expedition forward. This immersive bootcamp-style experience boasts interactive lectures, hands-on labs, and collaborative hackathons, all strategically designed to fortify fundamental concepts. Guided by seasoned coaches, each session offers priceless insights and practical skills crucial for honing your expertise. Whether you're stepping into the realm of professional skills or a seasoned professional, this comprehensive course ensures you're equipped with the knowledge and prowess necessary for success. While we feel this is the best course for the Certified Data Centre Expert (CDCE) course and one of our Top 10 we encourage you to read the course outline to make sure it is the right content for you. Additionally, private sessions, closed classes or dedicated events are available both live online and at our training centres in Dublin and London, as well as at your offices anywhere in the UK, Ireland or across EMEA.

BOHS P405 - Management of Asbestos in Buildings (including Asbestos Removal)
By Airborne Environmental Consultants Ltd
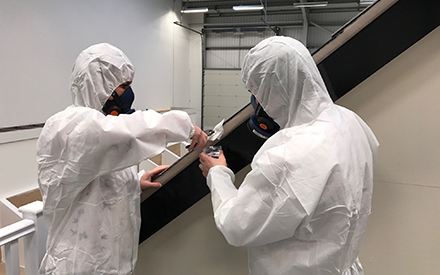
The main subject areas of the course are: Legislation and guidance for asbestos practitioners. The properties of asbestos and health effects of exposure to asbestos fibres. The types of asbestos and its uses in buildings. The types of asbestos surveys. The asbestos register, risk assessment and management plan. Asbestos remediation. The role of asbestos analysts and laboratory procedures.
Brush Calligraphy Drop-In Session
By Panda Scribes
Brush calligraphy for beginners. Drop-in session for you to come and pick up an activity pack and fill in at your leisure.
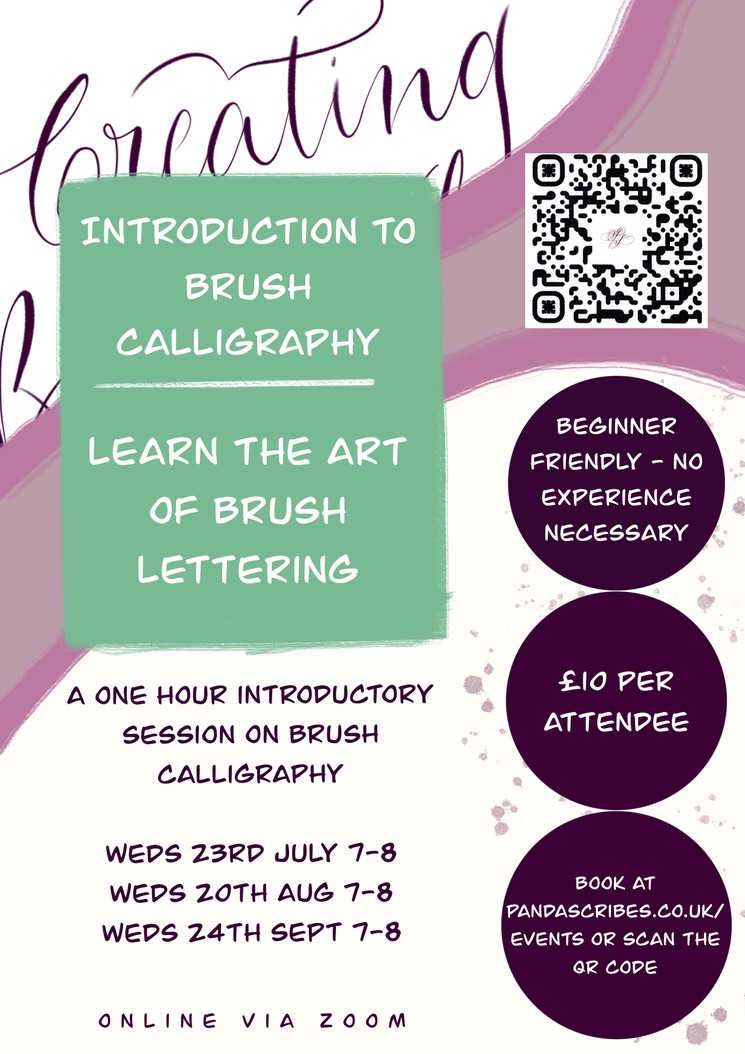
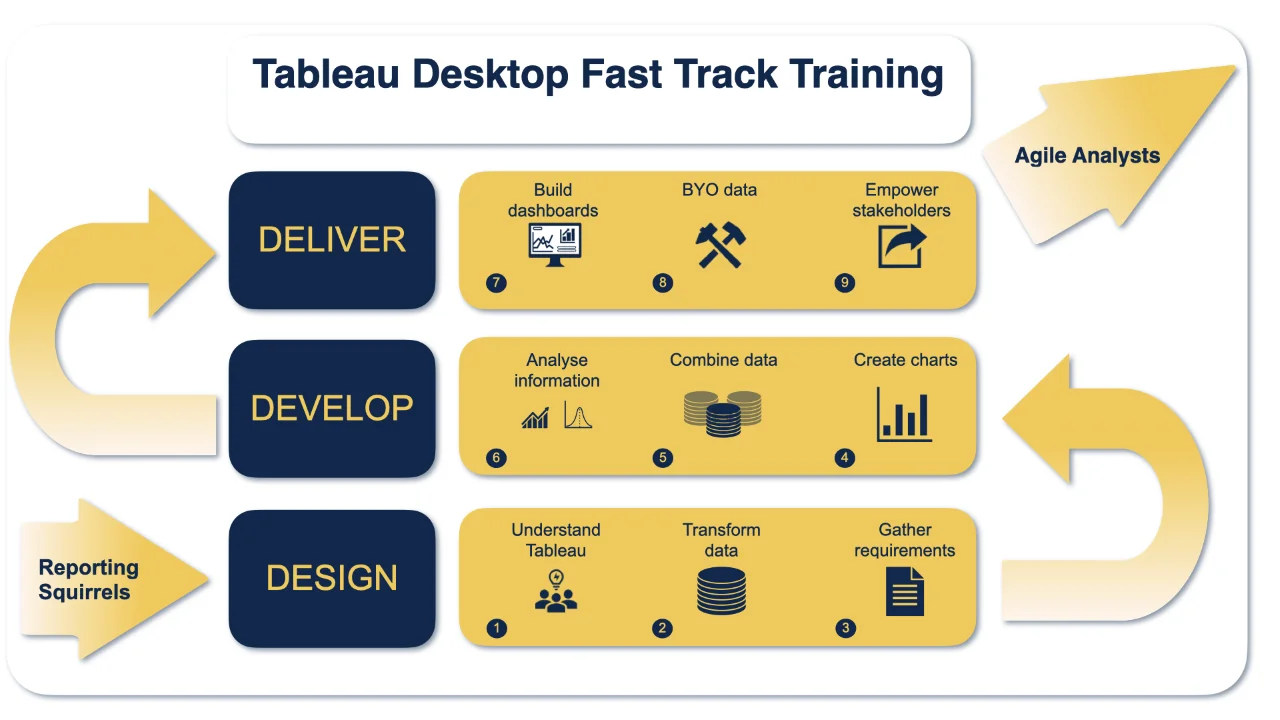
Tableau Training On Tap - Fast Track
By Tableau Training Uk
Tableau is an intuitive and simple tool to learn. This Tableau training course is a jumpstart to getting report writers and analysts who are self-taught or have no previous knowledge to being productive. It covers everything from connecting to data, through to creating interactive dashboards with a range of visualisations in three days. Having a quick turnaround from starting to use Tableau, to getting real, actionable insights means that you get a swift return on your investment. At the end of this course, you will be able to communicate insights more effectively, enabling your organisation to make better decisions, quickly. This accelerated approach is key to getting engagement from within your organisation so everyone can immediately see and feel the impact of the data and insights you create. Our Tableau Desktop Fast Track course combines all of our Foundation (Fundamentals) and Analyst (Intermediate) content into a 3 day live online course with added access to online bonus content of 3 additional modules. Gathering Requirements, Bring Your Own Data and Engaging Users. What do you get? This course is delivered live virtually and has all material provided through our online portal, together with email support and live coaching sessions. The full program includes all of the following elements: 3 days of live and interactive instructor-led sessions delivered by an expert Tableau Trainer 6 weeks access to our live coaching program delivered by expert Tableau coaches 50+ practical exercises to practice what you learn 12 months access to video’s that walk you through the theory and exercise solutions Practical advice, tools and resources for using Tableau in the real world The three additional online modules provide:Clarity on the approach to gathering dashboard requirements in a way that can be translated into dashboard designs.An agile and iterative development process that delivers products that meet user needs more quickly and effectively.An understanding of how end users will interact with dashboards to ensure that designers deliver actionable results. THE SYLLABUS PHASE 1: DESIGN MODULE 1: UNDERSTAND TABLEAU What is possible How does Tableau deal with data Know your way around Review of Type Conversions How do we format charts Dashboard basics – My first Dashboard MODULE 2: TRANSFORM DATA Connecting to and setting up data in Tableau Modifying data attributes How Do I Structure my Data – Groups & Hierarchies, Visual Groups How Tableau Deals with Dates – Using Discrete and Continuous Dates, Custom Dates How do I create calculated fields and why? – Creating Calculated Fields, Types of calculated fields, Row Level v Aggregations, Aggregating dimensions in calculations, Changing the Level of Detail (LOD) of calculations – What, Why, How MODULE 3: GATHER REQUIREMENTS(ONLINE CONTENT ONLY) Brainstorm and assess possible priorities Pitfalls to avoid Gather requirements PHASE 2: DEVELOP MODULE 4: CREATE CHARTS Charts that Compare Multiple Measures – Measure Names and Measure Values, Shared Axis Charts, Dual Axis Charts, Scatter Plots Showing progress over time Creating Tables – Creating Tables, Highlight Tables, Heat Maps Showing Relational & Proportional Data – Pie Charts, Donut Charts, Tree Maps Making things dynamic with parameters MODULE 5: COMBINE DATA Relationships Joining Tables – Join Types, Joining tables within the same database, cross database joins, join calculations Blending – How to create a blend with common fields, Custom defined Field relationships and mismatched element names, Calculated fields in blended data sources Unions – Manual Unions and mismatched columns, Wildcard unions Data Extracts – Creating & Editing Data extracts MODULE 6: ANALYSE INFORMATION Table Calculations Sets, Reference Lines, Trends and Forecasting Answering spatial questions – Mapping, Creating a choropleth (filled) map, Using your own images for spatial analysis, Mapping with spatial files Advanced charts Bar in Bar charts Bullet graphs Creating Bins and Histograms Creating a Box & Whisker plot Viz in Tooltips PHASE 3: DESIGN MODULE 7: BUILD DASHBOARDS Using the Dashboard Interface Device layouts Dashboard Actions – Set actions, Parameter actions Viz in Tooltips for Dashboards Dashboard containers – Horizontal & Vertical containers, Hidden containers Navigate between dashboards Telling data driven stories MODULE 8: BRING YOUR OWN DATA Design Best Practices & Resources Wireframe templates Questions Process Start building and testing MODULE 9: EMPOWER STAKEHOLDERS What is Tableau Server Publishing & permissions How can your users engage with content The Tableau ecosystem Review your progress Your next steps HOW MUCH OF YOUR TIME WILL THIS TAKE? Delegates are also provided 6 weeks access to our Tableau Coaching. We run Live Q&A sessions from 4pm-5pm on a Monday (Connecting to Data and Calculated Fields), 2pm-3pm Friday (Creating Charts) & 4pm-5pm Friday (Dashboard Design). The coaching helps delegates to transition from the theory of using Tableau to its practical use. We’d be expecting them to apply the exercises you’ll be doing during the course, onto your own data after the course. In our experience, this is the best way to increase both understanding and long term memory retention. The live coaching also acts as a troubleshooting platform for any practical issues that delegates need to overcome in the real world. Delegates also have 12 months access to all of the training material covered in the course in the form of an online portal (this includes theory videos, exercise solution videos, exercise materials and even quizzes). We have a growing LinkedIn community that delegates are encouraged to join and participate in. We regularly post useful blog posts and additional training that will enhance the Tableau journey and understanding. We help teams using Tableau to transform in the following ways : From a disjointed understanding of Tableau – To being familiar with Tableau terminology and capability From ad-hoc data uploads and error prone calculations – To reusable data connections and robust metrics From disjointed stakeholder questions – To clear and concise requirements that lead to decision making From being unsure how difficult Tableau will be to learn – To being able to develop standard charts and tables in Tableau with dynamic reporting capabilities From manually combining data for each analytical task – To dynamically combining data from multiple tables for analysis From being unsure how to answer analytical questions and what options there are – To being equipped with multiple actionable, dynamic, analytical use cases From not knowing Why, When and How to create Dashboards or Story’s – To being able to combine analysis to answer complex questions and tell data driven stories From using demo data theory – To Delivering value [Answering questions] on their own data From spending lots of time answering colleagues ad-hoc (data) questions – To empowering stakeholders in answering ad-hoc queries and reducing the time to analyse and steer the business
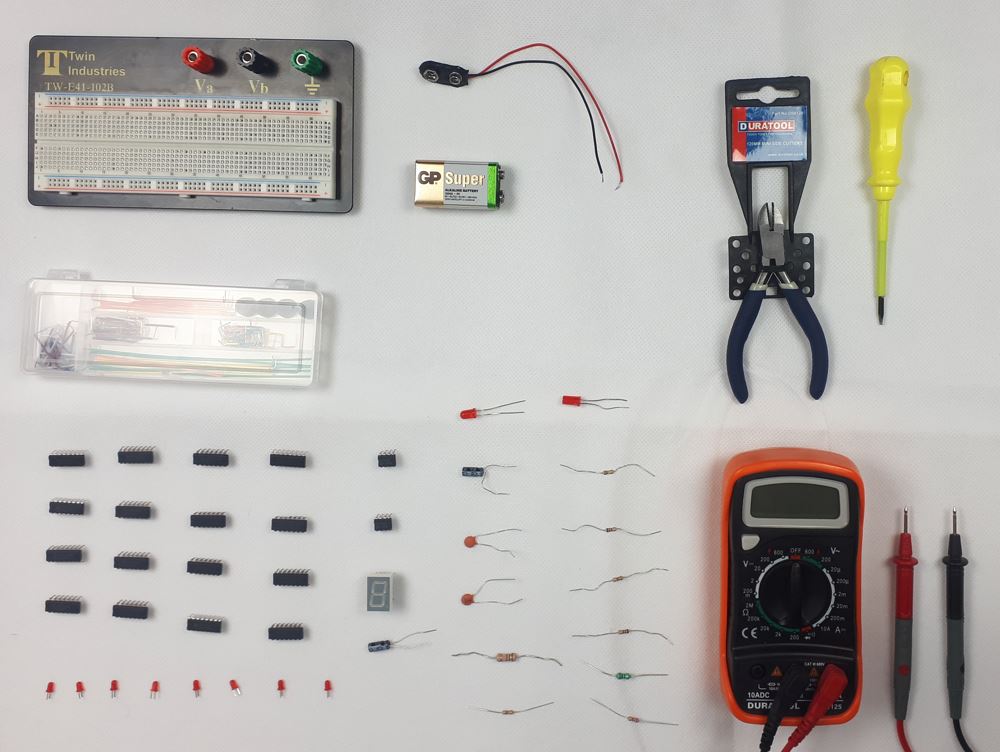
Digital Electronics Course Online
By Hi-Tech Training
This Digital Electronics Course is designed to give practical knowledge of the type of electronic circuitry used in a modern Computer System or in any type of Computer Controlled equipment such as Photocopiers, Cash Registers, Tablets, mobile phones and many other types of IT equipment. Digital Electronics involves the use of Silicon chips (Integrated Circuits). The internal structure of a computer is to a large extent comprised of Digital Electronic Circuits.
Piping Stress Engineering
By EnergyEdge - Training for a Sustainable Energy Future
About this Virtual Instructor Led Training (VILT) The 5 half-day Piping Stress Engineering Virtual Instructor Led Training (VILT) course will systematically expose participants to: The theory and practice of piping stress engineering, with special reference to ASME B 31.1 and ASME B 31.3 Standards. The basic principles and theories of stress and strain and piping stress engineering, through a series of lessons, case study presentations, in-class examples, multiple-choice questions (MCQs) and mandatory exercises. Principal stresses and shear stresses which form the backbone of stress analysis of a material. Expressions for these quantities will be derived using vector algebra from fundamentals. Thermal stress-range, sustained and occasional stresses, code stress equations, allowable stresses, how to increase flexibility of a piping system, cold spring. The historical development of computational techniques from hand calculations in the 1950s to the present-day software. Training Objectives On completion of this VILT course, participants will be able to: Identify potential loads the piping systems and categorise the loads to primary and secondary. Determine stresses that develop in a pipe due to various types of loads and how to derive stress-load relationships, starting from scratch. Treat the primary and secondary stresses in piping system in line with the intent of ASME Standards B 31.1 and B 31.3 and understand how the two codes deal with flexibility of piping systems, concepts of self-springing and relaxation/shake down, displacement stress range and fatigue, what is meant by code compliance. Understand the principles of flexibility analysis, piping elements and their individual effects, flexibility factor, flexibility characteristic, bending of a curved beam and importance of virtual length of an elbow in the flexibility of a piping system. Learn stress intensification factors of bends, branch connections and flanges. Understand how the stresses in the material should be controlled for the safety of the piping system, the user and the environment. Examine how codes give guidance to determine allowable stresses, stress range reduction due to cyclic loading, and effects sustained loads have on fatigue life of piping. Confidently handle terminal forces and moments on equipment. Understand the supplementary engineering standards required to establish acceptance of the equipment terminal loads and what can be done when there are no engineering standard governing equipment terminal loads is available and learn the techniques of local stress analysis. Get a thorough understanding of the concepts and the rules established by the ASME B 31.1 and ASME B 31.3 Standards. Perform flange load analysis calculations based on Kellogg's Equivalent Pressure method & Nuclear Code method. Perform the same using a piping stress analysis software and check for flange stresses and leakage. Confidently undertake formal training of piping stress analysis using any commercial software, with a clear understanding of what happens within the software rather than a 'blind' software training and start the journey of becoming a specialist piping stress engineer. Target Audience The VILT course is intended for: Recent mechanical engineering graduates who desire to get into the specialist discipline of Piping Stress Engineering. Junior mechanical, chemical, structural and project engineers in the industry who wish to understand the basics of Piping Stress Engineering. Engineers with some process plant experience who desire to progress into the much sought-after specialist disciplines of Piping Stress Engineering. Mechanical, process and structural engineers with some process plant experience who desire to upskill themselves with the knowledge in piping stress engineering and to become a Piping Stress Engineer. Any piping engineer with some pipe stressing experience in the industry who wish to understand the theory and practice of Piping Stress Engineering at a greater depth. A comprehensive set of course notes, practice exercises and multiple-choice questions (MCQs) are included. Participants will be given time to raise questions and participants will be assessed and graded based on responses to MCQs and mandatory exercises. A certificate will be issued to each participant and it will carry one of the three performance levels: Commendable, Merit or Satisfactory, depending on how the participant has performed in MCQs and mandatory exercises. Training Methods The VILT course will be delivered online in 5 half-day sessions comprising 4 hours per day, with 2 breaks of 10 minutes per day. Course Duration: 5 half-day sessions, 4 hours per session (20 hours in total). Trainer Your expert course leader is a fully qualified Chartered Professional Engineer with over 40 years of professional experience in Oil & Gas (onshore and offshore), Petrochemical and Mining industries in engineering, engineering/design management and quality technical management related to plant design and construction. At present, he is assisting a few Perth based oil & gas and mining companies in detail engineering, piping stress analysis, feasibility study and business development work related to plant design. He is a pioneer in piping stress engineering in Western Australia. His recent major accomplishments include the following roles and challenges: Quality Technical Support Manager of USD 54 billion (Gorgon LNG Project). This encompassed management of quality technical services connected with Welding, Welding Related Metallurgy, Non-Destructive Examination, Insulation /Refractory /Coating, AS2885 Pipelines Regulatory Compliance and Pressure Vessel Registration. Regional Piping Practice Lead and Lead Piping Engineer of Hatch Associates. In this role, he was responsible for providing discipline leadership to several mining projects for BHP Billiton (Ravensthorpe), ALCOA-Australia (Alumina), Maáden Saudi Arabia (Alumina), QSLIC China (Magnesium), COOEC China (O&G Gorgon). He was actively involved in the development of piping engineering practice in WA, including training and professional development of graduate, junior and senior engineers. This also includes the formation of the Piping Engineering Specialist Group. Lead Piping/Pipe Stress Engineer on ConocoPhillips' (COP) Bayu Undan Gas Recycle, Condensate production and processing platform. He was able to develop several novel design methodologies for the project and provided training to engineers on how to implement them. These methodologies were commended by COP and the underwriters of the project Lloyds Register of Shipping, UK. Creator of Piping Engineering Professional Course aimed at global engineering community. Professional Affiliations: Fellow, Institution of Mechanical Engineers, UK (IMechE) Fellow, Institution of Engineers, Australia (EA), National Register of Engineers (NER) Member American Society of Mechanical Engineers, USA (ASME) Honorary Life Member, Institution of Engineers, Sri Lanka (IESL) POST TRAINING COACHING SUPPORT (OPTIONAL) To further optimise your learning experience from our courses, we also offer individualized 'One to One' coaching support for 2 hours post training. We can help improve your competence in your chosen area of interest, based on your learning needs and available hours. This is a great opportunity to improve your capability and confidence in a particular area of expertise. It will be delivered over a secure video conference call by one of our senior trainers. They will work with you to create a tailor-made coaching program that will help you achieve your goals faster. Request for further information about post training coaching support and fees applicable for this. Accreditions And Affliations
