- Professional Development
- Medicine & Nursing
- Arts & Crafts
- Health & Wellbeing
- Personal Development
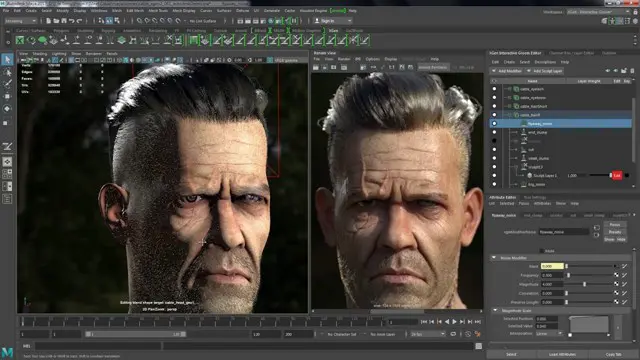
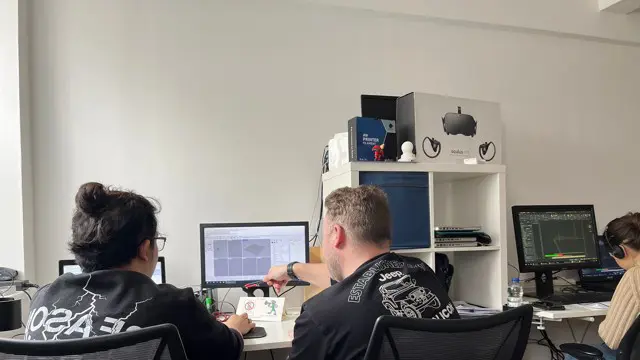
Autodesk Maya 10 hrs One to One training
By Real Animation Works
Autodesk face to face training customised and bespoke. Certified Tutors.
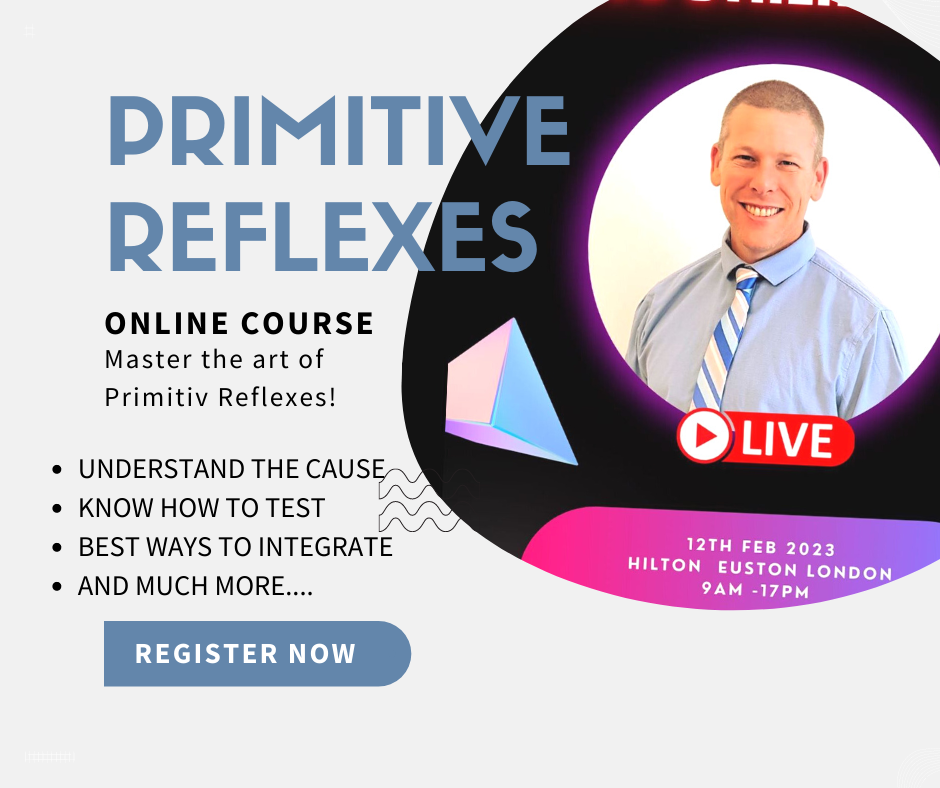
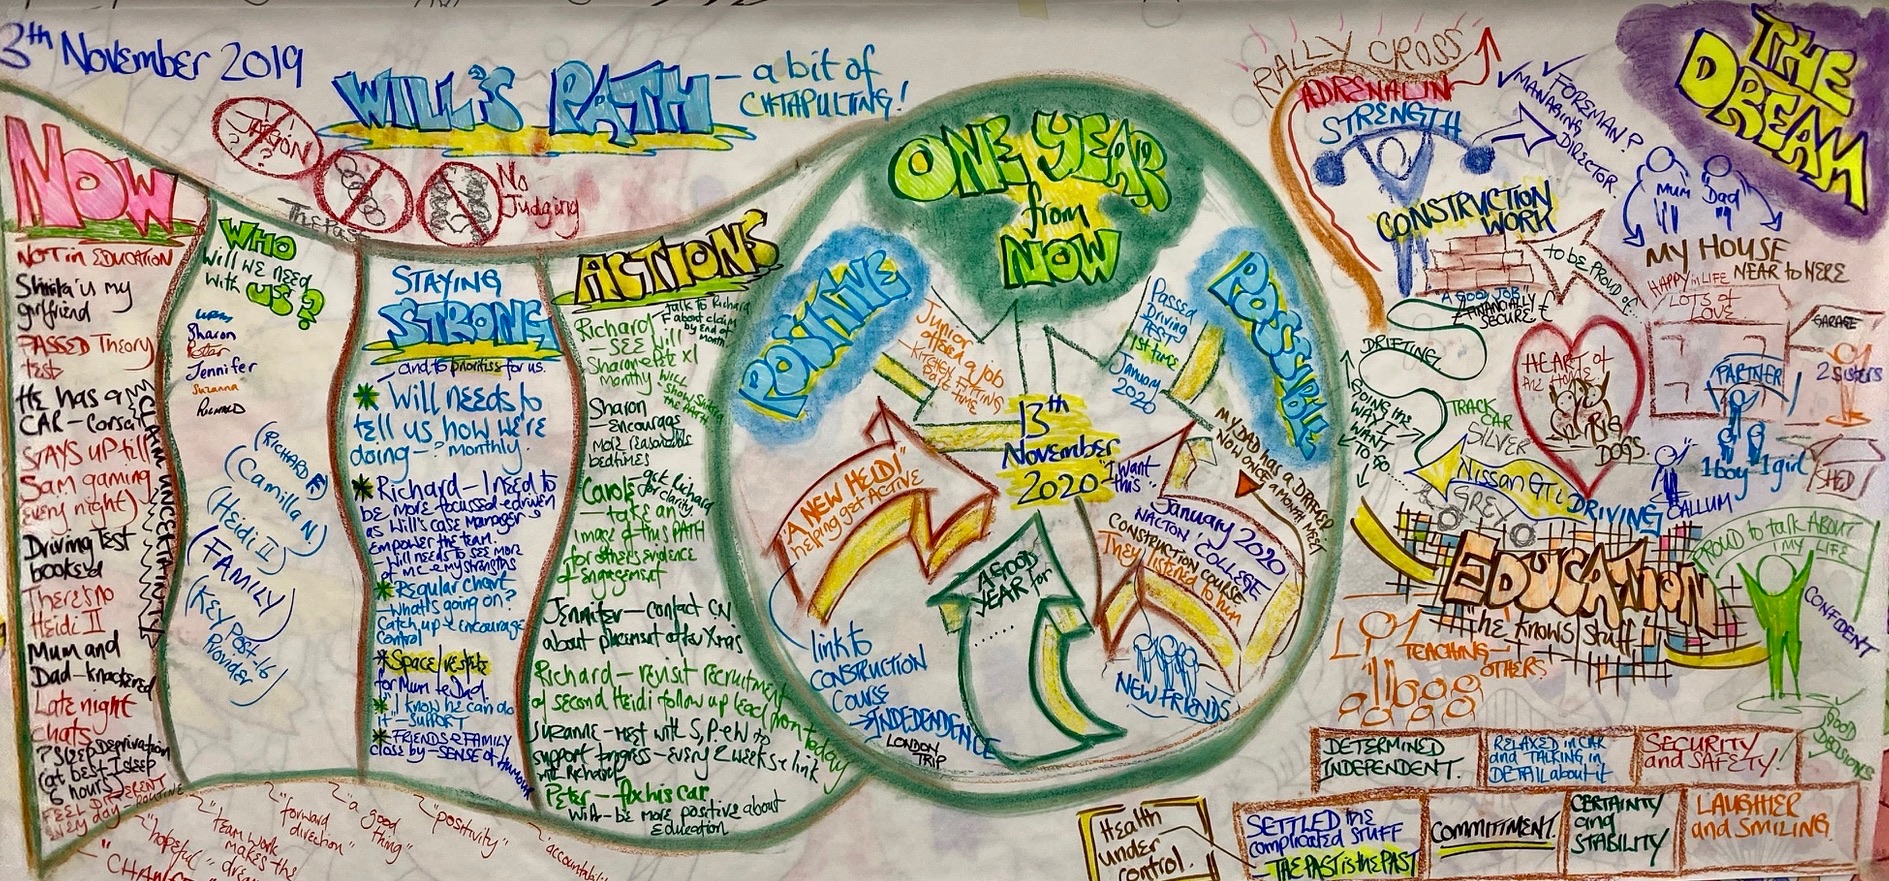
Primitive reflexes integration seminar by Dr. Omer Hirsh
By Hopeful Brain
Primitive reflexes are the foundation on which our entire nervous system is built! As we develop, our brain learns to integrate them, thus leading to more complex developmental stages. In developmental delays and disorders, as well as in brain injury, this process may be interrupted. Any Professional working with children or a parent interested in improving their child's care should know about these reflexes and how to integrate them. Join us on a full-day seminar with Dr. Omer Hirsh, a developmental disorders specialist, where we will learn what are primitive reflexes, what they look like, how to check for them, and when necessary - how to integrate them. This is the foundation. The seminar will include hands-on experience exercises and ways to integrate the primitive reflexes faster by introducing co-activation of the senses By the end of the seminar you will be able to: • Understand the cause of retained primitive reflexes • The importance of integrating primitive reflexes for normal brain development. • The connection between retained primitive reflexes and the maturation of different networks and paths in the brain. • Know how to test primitive reflexes correctly. • Avoid the traps many therapists fall into while testing for primitive reflexes. • Learn how to integrate primitive reflexes faster by co-activation. • Understand why in some circumstances primitive reflexes return (TBI, Trauma, Stroke) • Learn the correct exercises and how to motivate patients to do them at home. About the speaker: Dr. Omer Hirsh is a Doctor of Chiropractic, Developmental Disorders specialist, CSO and co-founder at eMazeLabs, Health and wellness entrepreneur, and Lecturer. Co-Founder & Clinical Director at Hopeful BrainIn his practice, he treats children with neurodevelopmental disorders. He earned his Fellowship in Childhood Neurodevelopmental Disorders with the International Board of Functional Neurology in 2018. Dr. Hirsh graduated as Valedictorian from Life Chiropractic College West in 2011 and has been taking postgraduate classes in Functional Neurology and Pediatrics since 2009. In 2014 Dr. Hirsh published his first translation to Hebrew of the very important book; “Disconnected Kids” written by Dr. Robert Melillo. Dr. Omer Hirsh has a great belief in helping children with learning disabilities and neurological problems.
Adobe Photoshop Training course One to One Weekends
By Real Animation Works
Photoshop pay per hr training flexible time weekend evening
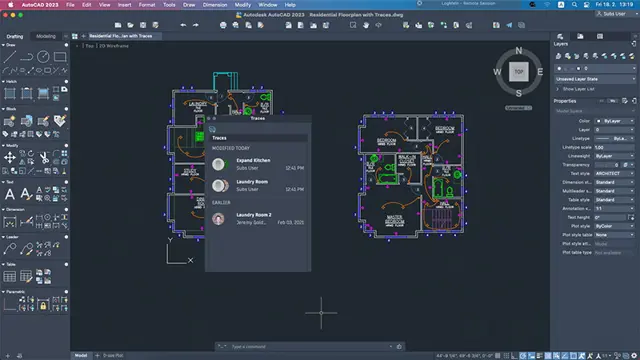
3ds max and Arnold Rendering one to one.
By Real Animation Works
Realistic rendering course with 3ds max and Arnold.

Vray for 3ds max One to One training Course
By Real Animation Works
Vray for 3ds max face to face training customised and bespoke.

Unity 3D One-Day Course (One-to-One)
By Real Animation Works
Photoshop basic to fundamentals Training Course bespoke and customized
Intermediate Adobe InDesign Online
By Platform Training
During this 1 day Intermediate level InDesign course you will explore powerful layout and typographical controls, working with layers, creating multipage documents, using clipping paths and preparing for print. This course is ideal for anybody who already uses InDesign and wishes to progress to a professional level. Comprehensive colour management, typography and advanced graphics and effects are also covered.
Advanced Visualization with Power BI (AVIAD)
By Online Productivity Training
OVERVIEW Prerequisites—DIAD training or equivalent working experience This one-day course will cover Power BI report layouts and structure the agile process to creating Power BI data visualizations. It will help attendees to understand the art behind visualizations, the implications behind choosing the right charts, the impact of color, shape, and size, and finally the use of Power BI custom visuals. The course includes various design patterns of dashboards and reports, as well as best practices for authoring great reports and dashboards for business users. The course content is managed by the Power BI engineering team at Microsoft. There is no exam associated with the course. COURSE BENEFITS: Understand the need for storytelling with data Understand the agile process to creating Power BI data visualizations Understand the art behind visualizations Gain familiarity with Power BI report layouts and structure Understand implications behind choosing the right charts Gain familiarity with using Power BI custom visuals WHO IS THE COURSE FOR? Power BI report developers who wish to improve the aesthetic quality of their reports Power BI and other BI practitioners who would like to understand more about the theory of data visualization BI practitioners who wish to create reports that communicate the meaning behind the data more clearly Power BI users who would like to explore the types of chart and visual available that answer different types of business question COURSE OUTLINE Module 1 What Is Storytelling With Data? Volume, Velocity and Variety The importance of business questions What is a story in this context? Module 2 The Science Behind Data Visualization Basic problems to avoid Memory and visualization Ways to spark iconic, short-term and long-term memory Module 3 The Process Behind Data Visualization Using an agile approach to report development Data structure and data grain Converting the story to a data model Module 4 Dashboards And Reports Terminology and definitions Dashboard layout and structure Report layout and structure Storyboarding Drill-through, bookmarks, toggles and tooltips Module 5 Chart Selection Charts for comparison Time series Proportions Constructing effective tables, cards and slicers Scatterplots Module 6 Accessibility And Custom Visuals Report accessibility checklists Custom visuals Creating a custom R visual Charticulator Module 7 Publishing And Formatting Colour schemes Making a Power BI theme Use of fonts, icons and symbols Sizing dashboard and report tiles Sparklines, hyperlinks and images Module 8 Report Authoring - Best Practices Design thought process The audience Defining the platform environment The user experience Visualization Implementation and testing Optimization Module 9 Dashboard And Goals Design Tips and tricks Best practices for dashboard design Tracking business metrics with goals