- Professional Development
- Medicine & Nursing
- Arts & Crafts
- Health & Wellbeing
- Personal Development
136 Courses in Belfast delivered On Demand
Power Query and Power Pivot in Microsoft Excel: A Quickstart Guide
By Ideas Into Action
Power Query and Power Pivot in Microsoft Excel: A Quickstart Guide Course Description Copyright Ross Maynard 2022 Course Description Power Query and Power Pivot are two tools available in Microsoft Excel. If you are serious about data analysis, then you need to know how to use these tools. This Quickstart guide will give you the skills you need to get started with these powerful features. The Power Query tool allows you to import external data and then modify it to meet your needs, before loading it into Excel. These editing tasks are all things you can do manually in Excel, but Power Query greatly speeds things up when you have a large volume of data. The Power Pivot tool allows you to connect multiple data tables in an extended pivot table. Power Pivot also introduces new analysis and query tools to further enhance data analysis. If data analysis is your thing, then this course will help you get up to speed with these feature-filled tools. Through screen-capture video, the course provides a step-by-step guide to the foundation skills needed to use both Power Query and Power Pivot effectively. The course is designed to make your first steps into Power Query easy and to build your confidence to use them on your own. Both Power Query and Power Pivot are also available in Microsoft Power BI – the data visualisation suite. Once you have learned how to use Power Query and Power Pivot in Excel with this course, you’ll have a head start in getting to grips with Power BI Get up to speed with Power Query and Power Pivot in Microsoft Excel with this Quickstart guide. Key Learning Points On completion of the course, delegates will be able to: Use Power Query to load data from an external source into Microsoft Excel Clean and manipulate external data before loading it into Excel Consolidate separate files with Power Query Update Excel tables with new data in the same format Use Power Query to “unpivot” report tables to prepare the data for analysis Explain the core functionality of Power Pivot Link data tables together in the Power Pivot data model Create pivot tables that draw data from several source data tables Create performance measures and new analysis in the Power Pivot data model Use the most popular DAX query language functions in Power Pivot Curriculum Lesson 1: Power Query Quickstart Lesson 2: Consolidating Files with Power Query Lesson 3: Unpivoting a Table Lesson 4: Power Pivot Quickstart Lesson 5: Power Pivot – Adding Data and Functionality Lesson 6: Key DAX Functions for Power Pivot Lesson 7: The DAX CALCULATE Function Lesson 8: Key Learning Points Pre-Course Requirements There are no pre-course requirements Additional Resources Starter spreadsheets for each lesson are provided so that learners can follow the steps presented. Course Tutor Your tutor is Ross Maynard. Ross is a Fellow of the Chartered Institute of Management Accountants in the UK and has 30 years’ experience as a process improvement consultant specialising in business processes and organisation development. Ross is also a professional author of online training courses. Ross lives in Scotland with his wife, daughter and Cocker Spaniel Questions What is the main feature of Power Query? The ability to link data tables together to create pivot tables that allow data to be drawn from any and all of the source tables The ability to clean and manipulate large volumes of external data efficiently and to load the result into Microsoft Excel The removal of Microsoft Excel’s restrictions on file sizes and the number of rows of data allowed The ability to visualise data in dashboards and management reports What is the main feature of Power Pivot? The ability to link data tables together to create pivot tables that allow data to be drawn from any and all of the source tables The ability to clean and manipulate large volumes of external data efficiently and to load the result into Microsoft Excel The removal of Microsoft Excel’s restrictions on file sizes and the number of rows of data allowed The ability to visualise data in dashboards and management reports Which of the following actions cannot be performed within Power Query? Split text into multiple columns Trimming text and removing spaces Creating calculated columns using DAX functions Make date based calculations Which of the following statements is true? You can use Power Query to combine files that have the same format and open them all in the same spreadsheet You can use Power Query to link data tables and create pivot tables that pull data items from all the linked tables You can use Power Query to create interactive dashboard reports You can use Power Query to export data files to Microsoft Access and other databases Which of the following provides a compelling case to use Power Pivot in Microsoft Excel? The data visualisation and presentation features of Power Pivot are much more powerful than those in Excel Power Pivot offers the ability to clean large files of data imported from other systems quickly Existing reports and tables can be “reverse engineered” (unpivoted) to create data tables for more advanced analysis Files sizes in Power Pivot are smaller than in Excel and there is no limit on the number of rows of data that can be stored. This makes it much faster and more efficient to use Power Pivot for large data sets Power Pivot uses analysis functions from the DAX formula language. What does “DAX” stand for? Digital Architecture Extraction Data Arbitrage Extrapolation Display Analytics Extension Data Analysis Expressions Deeply Annoying Exercise The DAX CALCULATE function is one of the most powerful and useful functions available in Power Pivot. Which statement best describes it? It performs row by row calculations defined by the user and adds the total of them all together for a specified table It performs row by row calculations defined by the user and displays the maximum result for a specified table It performs a defined calculation and then applies filters specified by the user It filters the data in a specified table according to criteria set by the user As well as in Power Pivot in Microsoft Excel, in what application are DAX functions also available? Microsoft PowerPoint Microsoft Forms Microsoft Teams Microsoft Power BI How do DAX functions differ from Microsoft Excel functions? DAX functions are designed specifically for use with SQL based data sources DAX functions are completely new and provide additional functionality within Microsoft Excel DAX functions never take a cell reference or a range as reference, but instead take a column or table as reference DAX date and time functions return a date as a serial number, whereas Excel date and time functions return a datetime data type
Register on the Create Animations Using Flourish Studio today and build the experience, skills and knowledge you need to enhance your professional development and work towards your dream job. Study this course through online learning and take the first steps towards a long-term career. The course consists of a number of easy to digest, in-depth modules, designed to provide you with a detailed, expert level of knowledge. Learn through a mixture of instructional video lessons and online study materials. Receive online tutor support as you study the course, to ensure you are supported every step of the way. Get a digital certificate as a proof of your course completion. The Create Animations Using Flourish Studio course is incredibly great value and allows you to study at your own pace. Access the course modules from any internet-enabled device, including computers, tablet, and smartphones. The course is designed to increase your employability and equip you with everything you need to be a success. Enrol on the now and start learning instantly! What You Get With The Create Animations Using Flourish Studio course Receive a e-certificate upon successful completion of the course Get taught by experienced, professional instructors Study at a time and pace that suits your learning style Get instant feedback on assessments 24/7 help and advice via email or live chat Get full tutor support on weekdays (Monday to Friday) Course Design The course is delivered through our online learning platform, accessible through any internet-connected device. There are no formal deadlines or teaching schedules, meaning you are free to study the course at your own pace. You are taught through a combination of Video lessons Online study materials Certification After the successful completion of the final assessment, you will receive a CPD-accredited certificate of achievement. The PDF certificate is for £9.99, and it will be sent to you immediately after through e-mail. You can get the hard copy for £15.99, which will reach your doorsteps by post. Who Is This Course For: The course is ideal for those who already work in this sector or are an aspiring professional. This course is designed to enhance your expertise and boost your CV. Learn key skills and gain a professional qualification to prove your newly-acquired knowledge. Requirements: The online training is open to all students and has no formal entry requirements. To study the Create Animations Using Flourish Studio course, all your need is a passion for learning, a good understanding of English, numeracy, and IT skills. You must also be over the age of 16. Course Content Introduction To Flourish Studio Welcome 00:04:00 Flourish Studio Background Story 00:01:00 Features of Flourish Studio 00:02:00 Flourish Studio Plans (Free, Business, Enterprise) 00:02:00 Getting Started With Flourish Signing up 00:02:00 Home Page Interface Walkthrough 00:06:00 Creating our First Flourish Visualisation 00:04:00 Adding And Managing Data In Flourish Templates Managing Data in Visualisations 00:08:00 Column Bindings 00:06:00 Merge Datasets 00:07:00 Creating Visualisations In Flourish Studio From Scratch Creating a Bar or Line Chart in Flourish Studio - First Steps 00:08:00 Changing Settings to update Chart's look and feel - 1 00:21:00 Changing Settings to update Chart's look and feel - 2 00:10:00 Changing Settings to update Chart's look and feel - 3 00:12:00 More Visualisation Templates In Flourish Studio Table Charts (including mini visualisations) 00:09:00 Creating a Hierarchy Visualisation 00:05:00 Scatter Plot 00:06:00 More interesting variations of Scatter Plot 00:04:00 Map & Projection Charts + 3D Maps 00:08:00 Survey Charts 00:07:00 Gantt Chart 00:06:00 Radar Chart in Flourish Studio 00:06:00 Creating A Story And Other Options How to create a Story in Flourish 00:13:00 Exporting, Publishing and Sharing 00:05:00 Flourish's Embed Options 00:06:00 How to Delete Projects 00:02:00 Other Exciting And Important Features Controlling access to Visualisations and stories with different Account Types 00:03:00 How to create a video or GIF from Flourish Visualisation/Story 00:04:00 How to generate the thumbnail of your visualisation 00:02:00 Customise colours in Flourish palettes 00:02:00 How to show published projects on your profile page 00:03:00 How to colour parts of your text with custom HTML 00:03:00 Add Social icons in Footer 00:02:00 Data Visualisation Tips & Resources How to select the right Visualisation Template 00:05:00 Dashboard Development Best Practices 00:04:00 Sources to get Datasets to use in Visualisations 00:02:00 Useful Resources to get Help & Continue Learning 00:06:00 Congratulations Congratulations on Course Completion 00:01:00 Frequently Asked Questions Are there any prerequisites for taking the course? There are no specific prerequisites for this course, nor are there any formal entry requirements. All you need is an internet connection, a good understanding of English and a passion for learning for this course. Can I access the course at any time, or is there a set schedule? You have the flexibility to access the course at any time that suits your schedule. Our courses are self-paced, allowing you to study at your own pace and convenience. How long will I have access to the course? For this course, you will have access to the course materials for 1 year only. This means you can review the content as often as you like within the year, even after you've completed the course. However, if you buy Lifetime Access for the course, you will be able to access the course for a lifetime. Is there a certificate of completion provided after completing the course? Yes, upon successfully completing the course, you will receive a certificate of completion. This certificate can be a valuable addition to your professional portfolio and can be shared on your various social networks. Can I switch courses or get a refund if I'm not satisfied with the course? We want you to have a positive learning experience. If you're not satisfied with the course, you can request a course transfer or refund within 14 days of the initial purchase. How do I track my progress in the course? Our platform provides tracking tools and progress indicators for each course. You can monitor your progress, completed lessons, and assessments through your learner dashboard for the course. What if I have technical issues or difficulties with the course? If you encounter technical issues or content-related difficulties with the course, our support team is available to assist you. You can reach out to them for prompt resolution.

Fall into Savings. Enjoy the biggest price fall this Autumn! Life Just Got Better This Summer! Get Hard Copy + PDF Certificates + Transcript + Student ID Card as a Gift - Enrol Now Tired of browsing and searching for the course you are looking for? Can't find the complete package that fulfils all your needs? Then don't worry as you have just found the solution. Take a minute and look through this 14-in-1 extensive bundle that has everything you need to succeed in Xero and other relevant fields! After surveying thousands of learners just like you and considering their valuable feedback, this all in one Xero bundle has been designed by industry experts. We prioritised what learners were looking for in a complete package and developed this in-demand Xero course that will enhance your skills and prepare you for the competitive job market. Also, our Xero experts are available for answering your queries and help you along your learning journey. Advanced audiovisual learning modules of these courses are broken down into little chunks so that you can learn at your own pace without being overwhelmed by too much material at once. Furthermore, to help you showcase your expertise in Xero, we have prepared a special gift of 1 hardcopy certificate and 1 PDF certificate for the title course completely free of cost. These certificates will enhance your credibility and encourage possible employers to pick you over the rest. This Xero Bundle Consists of the following Premium courses: Course 01: Level 3 Xero Training Course 02: Payroll Management - Diploma Course 03: Introduction to Accounting Course 04: Accounting and Bookkeeping Level 2 Course 05: Managerial Accounting Masterclass Course 06: Diploma in Quickbooks Bookkeeping Course 07: Theory of Constraints, Throughput Accounting and Lean Accounting Course 08: Internal Audit Training Diploma Course 09: Level 3 Tax Accounting Course 10: Team Management Course 11: Business Analysis Level 3 Course 12: GDPR Data Protection Level 5 Course 13: Microsoft Excel Training: Depreciation Accounting Course 14: Microsoft Excel Level 3 Benefits you'll get choosing Apex Learning for this Xero: Pay once and get lifetime access to 14 CPD courses Certificates, student ID for the title course included in a one-time fee Free up your time - don't waste time and money travelling for classes Accessible, informative modules designed by expert instructors Learn at your ease - anytime, from anywhere Study the course from your computer, tablet or mobile device CPD accredited course - improve the chance of gaining professional skills How will I get my Certificate? After successfully completing the course, you will be able to order your CPD Accredited Certificates (PDF + Hard Copy) as proof of your achievement. PDF Certificate: Free (For The Title Course) Hard Copy Certificate: Free (For The Title Course) Curriculum of Xero Bundle Course 01: Level 3 Xero Training Introduction Getting Started Invoices and Sales Bills and Purchases Bank Accounts Products and Services Fixed Assets Payroll VAT Returns Course 02: Payroll Management - Diploma Sage 50 Payroll for Beginners Module 1: Payroll Basics Module 2: Company Settings Module 3: Legislation Settings Module 4: Pension Scheme Basics Module 5: Pay Elements Module 6: The Processing Date Module 7: Adding Existing Employees Module 8: Adding New Employees Module 9: Payroll Processing Basics Module 10: Entering Payments Module 11: Pre-Update Reports Module 12: Updating Records Module 13: e-Submissions Basics Module 14: Process Payroll (November) Module 15: Employee Records and Reports Module 16: Editing Employee Records Module 17: Process Payroll (December) Module 18: Resetting Payments Module 19: Quick SSP Module 20: An Employee Leaves Module 21: Final Payroll Run Module 22: Reports and Historical Data Module 23: Year-End Procedures Sage 50 Payroll Intermediate Level Module 1: The Outline View and Criteria Module 2: Global Changes Module 3: Timesheets Module 4: Departments and Analysis Module 5: Holiday Schemes Module 6: Recording Holidays Module 7: Absence Reasons Module 8: Statutory Sick Pay Module 9: Statutory Maternity Pay Module 10: Student Loans Module 11: Company Cars Module 12: Workplace Pensions Module 13: Holiday Funds Module 14: Roll Back Module 15: Passwords and Access Rights Module 16: Options and Links Module 17: Linking Payroll to Accounts Course 03: Introduction to Accounting Accounting Fundamental What is Financial Accounting Accounting Double Entry System and Fundamental Accounting Rules Financial Accounting Process and Financial Statements Generates Basic Accounting Equation and Four Financial Statements Define Chart of Accounts and Classify the accounts External and Internal Transactions with companies Short Exercise to Confirm what we learned in this section Accounting Policies What are Major Accounting Policies need to be decided by companies Depreciation Policies Operational Fixed Asset Controls Inventory Accounting and Controls Revenue Accounting and Controls Course 04: Accounting and Bookkeeping Level 2 Introduction to the course Introduction to Bookkeeping Bookkeeping systems Basics of Bookkeeping The functionality of bookkeeping On a personal note Course 05: Managerial Accounting Masterclass Setion 1 Manaerial Accounting Defined Financial Accounting Compared to Managerial Accounting Trends Foundation Concepts Setion 2 Process costing vs Job Cost Job cost part 1 Job cost part 2 Allocating costs to multiple products Departmental Overhead Rate Activity-Based Costing Setion 3 Cost Behavior Cost Behavior Continued Break Even Point Break Even Point Changes Sales Mix Pricing Short Term Decisions Section 4 Budgeting Intro Budgetin continued Operating Budgets Cash Budget Budgeted Balance Sheet Performance Evaluation Performance Evaluation Cont Standards Standard Costs Continued Setion 5 Capital Investment Decisions Capital Investment Analysis Course 06: Diploma in Quickbooks Bookkeeping Getting prepared - access the software and course materials Getting started Setting up the system Nominal ledger Customers Suppliers Sales ledger Purchases ledger Sundry payments Sundry receipts Petty cash VAT - Value Added Tax Bank reconciliation Payroll / Wages Reports Tasks Course 07: Theory of Constraints, Throughput Accounting and Lean Accounting The Theory of Constraints and Throughput Accounting Lean Accounting Summary and Lean Accounting Assignment Course 08: Internal Audit Training Diploma Auditing as a Form of Assurance Internal Audit Procedures Technology-based Internal Audit Internal Control and Control Risk Audit Interviews Reporting Audit Outcome UK Internal Audit Standards Career as an Auditor Course 09: Level 3 Tax Accounting Tax System and Administration in the UK Tax on Individuals National Insurance How to Submit a Self-Assessment Tax Return Fundamentals of Income Tax Advanced Income Tax Payee, Payroll and Wages Capital Gain Tax Value Added Tax Import and Export Corporation Tax Inheritance Tax Double Entry Accounting Management Accounting and Financial Analysis Career as a Tax Accountant in the UK Course 10: Presenting Financial Information Presenting Financial Information The Hierarchy of Performance Indicators The Principle of Effective Reports Guidelines for Designing Management Reports Methods of Presenting Performance Data The Control Chart: Highlighting the Variation in the Data The Pareto Chart: Highlighting Priorities Exercise: The Control Chart An Example Management Report Interpreting Performance Data Supporting Colleagues by Giving Feedback Data Visualisation Final Thoughts on Presenting Financial Information Course 11: Business Analysis Level 3 Introduction to Business Analysis Business Processes Business Analysis Planning and Monitoring Strategic Analysis and Product Scope Solution Evaluation Investigation Techniques Ratio Analysis Stakeholder Analysis and Management Course 12: GDPR Data Protection Level 5 GDPR Basics GDPR Explained Lawful Basis for Preparation Rights and Breaches Responsibilities and Obligations Course 13: Microsoft Excel Training: Depreciation Accounting Introduction Depreciation Amortization and Related Terms Various Methods of Depreciation and Depreciation Accounting Depreciation and Taxation Master Depreciation Model Conclusion Course 14: Microsoft Excel Level 3 Microsoft Excel 2019 New Features Getting Started with Microsoft Office Excel Performing Calculations Modifying a Worksheet Formatting a Worksheet Printing Workbooks Managing Workbooks Working with Functions Working with Lists Analyzing Data CPD 115 CPD hours / points Accredited by CPD Quality Standards Who is this course for? Anyone from any background can enrol in this Xero bundle. Persons with similar professions can also refresh or strengthen their skills by enrolling in this course. Students can take this course to gather professional knowledge besides their study or for the future. Requirements Our Xero is fully compatible with PC's, Mac's, laptops, tablets and Smartphone devices. This course has been designed to be fully compatible with tablets and smartphones so that you can access your course on Wi-Fi, 3G or 4G. There is no time limit for completing this course; it can be studied in your own time at your own pace. Career path Having this various expertise will increase the value of your CV and open you up to multiple job sectors. Certificates Certificate of completion Digital certificate - Included Certificate of completion Hard copy certificate - Included You will get the Hard Copy certificate for the title course (Level 3 Xero Training) absolutely Free! Other Hard Copy certificates are available for £10 each. Please Note: The delivery charge inside the UK is £3.99, and the international students must pay a £9.99 shipping cost.

Dive deep into the vast realm of Python data science with our meticulously crafted course: 'Python Data Science with Numpy, Pandas and Matplotlib'. Explore the intricate details of Python, setting the stage with Pandas and Numpy, before delving into the power of Python data structures. With topics ranging from Python Strings to Matplotlib Histograms, you'll gain a holistic insight, ensuring that every dataset you touch unveils its story compellingly. So, if you're keen on transmuting raw data into visual masterpieces or insights, this journey is tailor-made for you. Learning Outcomes Grasp foundational knowledge of Python and its data structures like strings, lists, and dictionaries. Understand the potential of NumPy, from basic array operations to handling multi-dimensional arrays. Master the versatility of Pandas, encompassing everything from dataframe conversions to intricate operations like aggregation and binning. Efficiently manage, manipulate, and transform data using Pandas' diverse functionalities. Create visually striking and informative graphs using the power of Matplotlib. Why buy this Python Data Science with Numpy, Pandas and Matplotlib course? Unlimited access to the course for forever Digital Certificate, Transcript, student ID all included in the price Absolutely no hidden fees Directly receive CPD accredited qualifications after course completion Receive one to one assistance on every weekday from professionals Immediately receive the PDF certificate after passing Receive the original copies of your certificate and transcript on the next working day Easily learn the skills and knowledge from the comfort of your home Certification After studying the course materials of the Python Data Science with Numpy, Pandas and Matplotlib there will be a written assignment test which you can take either during or at the end of the course. After successfully passing the test you will be able to claim the pdf certificate for £5.99. Original Hard Copy certificates need to be ordered at an additional cost of £9.60. Who is this Python Data Science with Numpy, Pandas and Matplotlib course for? Beginners eager to jumpstart their journey in Python data science. Analysts looking to enhance their data manipulation skills using Python. Statisticians keen on expanding their toolset with Python-based libraries. Data enthusiasts desiring a deep dive into Python's data libraries and structures. Professionals aiming to upgrade their data visualisation techniques. Prerequisites This Python Data Science with Numpy, Pandas and Matplotlib does not require you to have any prior qualifications or experience. You can just enrol and start learning.This Python Data Science with Numpy, Pandas and Matplotlib was made by professionals and it is compatible with all PC's, Mac's, tablets and smartphones. You will be able to access the course from anywhere at any time as long as you have a good enough internet connection. Career path Data Scientist: £40,000 - £80,000 Python Developer: £35,000 - £70,000 Data Analyst: £30,000 - £55,000 Business Intelligence Analyst: £32,000 - £60,000 Research Analyst: £28,000 - £52,000 Data Visualization Engineer: £33,000 - £65,000 Course Curriculum Course Introduction and Table of Contents Course Introduction and Table of Contents 00:09:00 Introduction to Python, Pandas and Numpy Introduction to Python, Pandas and Numpy 00:07:00 System and Environment Setup System and Environment Setup 00:08:00 Python Strings Python Strings - Part 1 00:11:00 Python Strings - Part 2 00:09:00 Python Numbers and Operators Python Numbers and Operators - Part 1 00:06:00 Python Numbers and Operators - Part 2 00:07:00 Python Lists Python Lists - Part 1 00:05:00 Python Lists - Part 2 00:06:00 Python Lists - Part 3 00:05:00 Python Lists - Part 4 00:07:00 Python Lists - Part 5 00:07:00 Tuples in Python Tuples in Python 00:06:00 Sets in Python Sets in Python - Part 1 00:05:00 Sets in Python - Part 2 00:04:00 Python Dictionary Python Dictionary - Part 1 00:07:00 Python Dictionary - Part 2 00:07:00 NumPy Library - Introduction NumPy Library Intro - Part 1 00:05:00 NumPy Library Intro - Part 2 00:05:00 NumPy Library Intro - Part 3 00:06:00 NumPy Array Operations and Indexing NumPy Array Operations and Indexing - Part 1 00:04:00 NumPy Array Operations and Indexing - Part 2 00:06:00 NumPy Multi-Dimensional Arrays NumPy Multi-Dimensional Arrays - Part 1 00:07:00 NumPy Multi-Dimensional Arrays - Part 2 00:06:00 NumPy Multi-Dimensional Arrays - Part 3 00:05:00 Introduction to Pandas Series Introduction to Pandas Series 00:08:00 Introduction to Pandas Dataframes Introduction to Pandas Dataframes 00:07:00 Pandas Dataframe conversion and drop Pandas Dataframe conversion and drop - Part 1 00:06:00 Pandas Dataframe conversion and drop - Part 2 00:06:00 Pandas Dataframe conversion and drop - Part 3 00:07:00 Pandas Dataframe summary and selection Pandas Dataframe summary and selection - Part 1 00:06:00 Pandas Dataframe summary and selection - Part 2 00:06:00 Pandas Dataframe summary and selection - Part 3 00:07:00 Pandas Missing Data Management and Sorting Pandas Missing Data Management and Sorting - Part 1 00:07:00 Pandas Missing Data Management and Sorting - Part 2 00:07:00 Pandas Hierarchical-Multi Indexing Pandas Hierarchical-Multi Indexing 00:06:00 Pandas CSV File Read Write Pandas CSV File Read Write - Part 1 00:05:00 Pandas CSV File Read Write - Part 2 00:07:00 Pandas JSON File Read Write Pandas JSON File Read Write Operations 00:07:00 Pandas Concatenation Merging and Joining Pandas Concatenation Merging and Joining - Part 1 00:05:00 Pandas Concatenation Merging and Joining - Part 2 00:04:00 Pandas Concatenation Merging and Joining - Part 3 00:04:00 Pandas Stacking and Pivoting Pandas Stacking and Pivoting - Part 1 00:06:00 Pandas Stacking and Pivoting - Part 2 00:05:00 Pandas Duplicate Data Management Pandas Duplicate Data Management 00:07:00 Pandas Mapping Pandas Mapping 00:04:00 Pandas Grouping Pandas Groupby 00:06:00 Pandas Aggregation Pandas Aggregation 00:09:00 Pandas Binning or Bucketing Pandas Binning or Bucketing 00:08:00 Pandas Re-index and Rename Pandas Re-index and Rename - Part 1 00:04:00 Pandas Re-index and Rename - Part 2 00:05:00 Pandas Replace Values Pandas Replace Values 00:05:00 Pandas Dataframe Metrics Pandas Dataframe Metrics 00:07:00 Pandas Random Permutation Pandas Random Permutation 00:08:00 Pandas Excel sheet Import Pandas Excel sheet Import 00:07:00 Pandas Condition Selection and Lambda Function Pandas Condition Selection and Lambda Function - Part 1 00:05:00 Pandas Condition Selection and Lambda Function - Part 2 00:05:00 Pandas Ranks Min Max Pandas Ranks Min Max 00:06:00 Pandas Cross Tabulation Pandas Cross Tabulation 00:07:00 Matplotlib Graphs and plots Graphs and plots using Matplotlib - Part 1 00:06:00 Graphs and plots using Matplotlib - Part 2 00:02:00 Matplotlib Histograms Matplotlib Histograms 00:03:00 Resource File Resource File - Python Data Science with Numpy, Pandas and Matplotlib 00:00:00

Journalism is a noble and respective profession. Journalists bear the burden of presenting the crucial news and information to the mass people. If you want to build your career as a journalist or in the media industry, this journalism course can be the first step towards your professional journey. Learn the necessary skills you need to be a journalist from this Journalism course today. Our Journalism course lessons were prepared by experts and feature interactive activities. You'll learn how you can use various opportunities effectively from industry experts. This Journalism course has been divided into understandable and manageable sections that will help you grasp each concept- from the basic to advanced course components. Learn from industry experts today and enhance your skills and knowledge in no time. This Journalism course will increase your possibility to get your desired job and boost your personal growth. Learning Objectives Learn the basic principles of journalism Understand the roles and responsibilities of a journalist Familiarise with the ethical values and aspects of journalism Learn about various legal regulations and obligations Understand the language of journalism Be able to take notes fast and effectively Learn how to present your news attractively Grasp effective tips about data visualisation and presentation Who is this Course for? The Journalism course is ideal for highly aspiring individuals who wish to enhance their professional skills and train for the job they want! Also, this course is highly beneficial for people who want to have some in-depth knowledge on this topic and keep up to date with the latest information. So, you can enrol in this course if you are: Journalists Reporters Editors News Presenters News Researchers Study the Journalism course today and enhance your professional skillset from the comfort of your home! Entry Requirement There are no formal entry requirements for the Journalism course; with enrollment, this course is open to anyone! Anyone with a passion for learning about Journalism can enrol in this course without any hesitation. Although, the learner should be aged 16 or over to enrol in this course. Also, they need to have a good understanding of the English language to attend this course and understand what this course is about. CPD Certificate from Course Gate At the successful completion of the course, you can obtain your CPD certificate from us. You can order the PDF certificate for £4.99 and the hard copy for £9.99. Also, you can order both PDF and hardcopy certificates for £12.99. Career path This Journalism course will help you gain all the necessary theoretical knowledge to excel in the relevant field. Enrol on our Journalism course now and get started on the journey of taking your career to the next level. Course Curriculum Module 01: Introduction and Principles of Journalism Introduction and Principles of Journalism 00:18:00 Module 02: History and Development of Journalism History and Development of Newspaper Journalism 00:26:00 Module 03: Interviewing Interviewing 00:35:00 Module 04: Newspaper Journalism Newspaper Journalism 00:30:00 Module 05: News Writing, Production and Reporting News Writing, Production and Reporting 00:20:00 Module 06: Television Journalism Television Journalism 00:32:00 Module 07: Radio Journalism Radio Journalism 00:37:00 Module 08: Media Regulatory Bodies Media Regulatory Bodies 00:31:00 Module 09: Writing Skills for Journalists Writing Skills for Journalists 00:41:00 Module 10: Journalism law Journalism Law 00:35:00 Module 11: Defamation Defamation 00:20:00 Module 12: Journalism Ethics Journalism Ethics 00:17:00 Module 13: Health and Safety for Journalists Health and Safety for Journalists 00:38:00 Module 14: Niche Journalism Niche Journalism 00:24:00 Module 15: Tips on Writing a Good Feature Story Tips on Writing a Good Feature Story 00:34:00 Module 16: Online and Freelance Journalism Online and Freelance Journalism 00:16:00 Module 17: Becoming a Journalist Becoming a Journalist 00:29:00 Certificate and Transcript Order Your Certificates or Transcripts 00:00:00

Data Analysis: Data Analysis Training Have you ever wondered how companies get insights from massive volumes of data to stay competitive and make wise decisions? If so, then participate in our exclusive Data Analysis: Data Analysis Course. This Data Analysis Course describes the fundamentals of data, statistics, and an introduction to Data Analysis. How to get data and where to find it is explained in the Data Analysis Course. Moreover, this Data Analysis Course covers data cleansing, preprocessing, and exploratory data analysis (EDA). Additionally, the Data Analysis Course provides an introduction to Python and Excel for Data Analysis. This thorough Data Analysis Course includes lessons on data wrangling with Pandas (python) and data visualisation using Matplotlib and Seaborn (python). Enrol in our Data Analysis Course to study the fundamentals of statistical analysis and machine learning. Main Course: Data Analysis (Data Analytics) Training Free Courses included with Data Analysis: Data Analysis Training Course: Course 01: Minute Taking Course 02: GDPR Course 03: Cyber Security [ Note: Free PDF certificate as soon as completing the Data Analysis: Data Analysis Training Course] Data Analysis: Data Analysis Training Online This Data Analysis (Data Analytics) Training consists of 12 modules. Curriculum of Data Analysis (Data Analytics) Training Course Module 1: Introduction to Data Analytics Module 2: Basics of Data and Statistics Module 3: Data Collection and Sources Module 4: Data Cleaning and Preprocessing Module 5: Exploratory Data Analysis (EDA) Module 6: Introduction to Excel for Data Analytics Module 7: Introduction to Python for Data Analytics Module 8: Data Wrangling with Pandas (Python) Module 9: Data visualisation with Matplotlib and Seaborn (Python) Module 10: Introduction to Basic Statistical Analysis Module 11: Introduction to Machine Learning Module 12: Capstone Project - Exploratory Data Analysis Assessment Method of Data Analysis (Data Analytics) Training Course After completing Data Analysis: Data Analysis Training Course, you will get quizzes to assess your learning. You will do the later modules upon getting 60% marks on the quiz test. Apart from this, you do not need to sit for any other assessments. Certification of Data Analysis (Data Analytics) Training Course After completing the Data Analysis: Data Analysis Training Course, you can instantly download your certificate for FREE. The hard copy of the certification will also be delivered to your doorstep via post, which will cost £13.99. Who is this course for? Data Analysis: Data Analysis Training Online For business professionals, entrepreneurs, or anybody else looking to have a thorough grasp of data analysis in a commercial setting, this Data Analysis Course is ideal. Requirements Data Analysis: Data Analysis Training Online To enrol in this Data Analysis: Data Analysis Training Course, students must fulfil the following requirements: Good Command over English language is mandatory to enrol in our Data Analysis Training Course. Be energetic and self-motivated to complete our Data Analysis Training Course. Basic computer Skill is required to complete our Data Analysis Training Course. If you want to enrol in our Data Analysis Training Course, you must be at least 15 years old. Career path Data Analysis: Data Analysis Training Online This Data Analysis Course will assist you in obtaining positions as a business analyst, marketing analyst, data analysis, and in related fields.

Complete Data Analysis Course
By Wise Campus
Data Analysis: Data Analysis Course Would you like to acquire the skills and self-assurance necessary to make wise choices and successfully traverse the intricate and ever-changing realm of data analysis? Enrol in our Data Analysis Course. The fundamentals of data, statistics, and an introduction to data analysis are all covered in this data analysis course. The how-to of data collection and its sources are explained in the Data Analysis Course. This Data Analysis Course teaches preprocessing, data cleansing, and exploratory data analysis (EDA). An overview of Excel and Python for data analysis is explained in this Data Analysis Course. This extensive Data Analysis course includes lessons on data wrangling with Pandas (Python) and data visualisation using Matplotlib and Seaborn (Python). So, quickly join our Data Analysis Course to learn the fundamentals of machine learning and statistical analysis! Special Offers with free gifts for this Data Analysis: Data Analysis Course This Data Analysis Course course includes a FREE PDF Certificate. Lifetime access to this Data Analysis Course course Instant access to this Data Analysis Course course Get FREE Tutor Support to this Data Analysis Course Course Learning Outcome of Data Analysis Course This Data Analysis Course will help you learn about: Introduction to data analysis, basics of data, and statistics. Data Analysis Course explains how to collect data and its sources. Data cleaning, processing, and exploratory data analysis (EDA) are included in this Data Analysis Course. This Data Analysis Course describes an introduction to Excel for Data Analysis and Python for Data Analysis. Data Wrangling with Pandas (Python) and Data Visualisation with Matplotlib and Seaborn (Python) are parts of this comprehensive Data Analysis Course. With the help of this Data Analysis Course, you will learn the basics of statistical analysis and machine learning. Data Analysis: Data Analysis Course Embark on a transformative journey with our Data Analysis course, designed for beginners. Dive deep into the world of data analysis, mastering essential techniques and tools. Gain practical skills in Data Analysis, empowering you to unlock insights and drive informed decisions. Start your Data Analysis journey today! Who is this course for? Data Analysis: Data Analysis Course Anyone looking to have a thorough grasp of data analysis in a commercial setting should take this Data Analysis: Data Analysis Course. Requirements Data Analysis: Data Analysis Course To enrol in this Data Analysis: Data Analysis Course, students must fulfil the following requirements. To join in our Data Analysis: Data Analysis Course, you must have a strong command of the English language. To successfully complete our Data Analysis: Data Analysis Course, you must be vivacious and self driven. To complete our Data Analysis: Data Analysis Course, you must have a basic understanding of computers. A minimum age limit of 15 is required to enrol in this Data Analysis: Data Analysis Course. Career path Data Analysis: Data Analysis Course With the assistance of this Data Analysis Course, you can obtain work as a data analyst, business analyst, marketing analyst, or in related fields.
Dive into the intricate world of numbers and data with our comprehensive 'Microsoft Excel & Accounting Training' course. Begin your journey by mastering the foundational elements of Microsoft Office Excel 2016, from the basics of worksheet modifications to the art of data visualisation using charts. As you progress, pivot your attention towards the meticulous realm of accounting. Here, you'll unravel the secrets of the accounting equation, immerse yourself in transaction analyses, and culminate your learning by understanding the complete accounting cycle. Whether you're looking to enhance your data management skills or embark on a career in accounting, this course is your stepping stone to success. Learning Outcomes: Acquire proficiency in utilising Microsoft Excel 2016 for data analysis, visualisation, and workbook management. Understand the core principles of accounting, including the accounting equation and transaction analysis. Demonstrate the ability to prepare financial statements and complete the accounting cycle. Implement advanced Excel features such as PivotTables, PivotCharts, and Lookup Functions. Apply knowledge in real-world scenarios, including fiscal year evaluations and spreadsheet exercises. Why buy this Microsoft Excel & Accounting Training? Unlimited access to the course for a lifetime. Opportunity to earn a certificate accredited by the CPD Quality Standards after completing this course. Structured lesson planning in line with industry standards. Immerse yourself in innovative and captivating course materials and activities. Assessments are designed to evaluate advanced cognitive abilities and skill proficiency. Flexibility to complete the Microsoft Excel & Accounting Training Course at your own pace, on your own schedule. Receive full tutor support throughout the week, from Monday to Friday, to enhance your learning experience Who is this Microsoft Excel & Accounting Training course for? Individuals aiming to bolster their data analysis and management capabilities. Aspiring accountants keen on understanding the fundamentals of the profession. Business owners desiring a deeper grasp of financial statements and accounting cycles. Students pursuing a career in finance or data management. Professionals looking to integrate Excel functionalities into their daily tasks. Career path Data Analyst: Average salary range: £25,000 - £40,000 Annually Accountant: Average salary range: £28,000 - £52,000 Annually Financial Controller: Average salary range: £40,000 - £70,000 Annually Management Accountant: Average salary range: £30,000 - £55,000 Annually Excel Specialist: Average salary range: £22,000 - £35,000 Annually Bookkeeper: Average salary range: £18,000 - £30,000 Annually Prerequisites This Microsoft Excel & Accounting Training does not require you to have any prior qualifications or experience. You can just enrol and start learning.This Microsoft Excel & Accounting Training was made by professionals and it is compatible with all PC's, Mac's, tablets and smartphones. You will be able to access the course from anywhere at any time as long as you have a good enough internet connection. Certification After studying the course materials, there will be a written assignment test which you can take at the end of the course. After successfully passing the test you will be able to claim the pdf certificate for £4.99 Original Hard Copy certificates need to be ordered at an additional cost of £8. Course Curriculum **Microsoft Excel** Getting Started with Microsoft Office Excel 2016 Navigate the Excel User Interfact 00:28:00 Use Excel Commands 00:10:00 Create and Save a Basic Workbook 00:19:00 Enter Cell Data 00:12:00 Use Excel Help 00:05:00 Performing Calculations Create Worksheet Formulas 00:15:00 Insert Functions 00:17:00 Reuse Formulas and Functions 00:17:00 Modifying a Worksheet Insert, Delete, and Adjust Cells, Columns, and Rows 00:10:00 Search for and Replace Data 00:09:00 Use Proofing and Research Tools 00:07:00 Formatting a Worksheet Apply Text Formats 00:16:00 Apply Number Format 00:07:00 Align Cell Contents 00:09:00 Apply Styles and Themes 00:12:00 Apply Basic Conditional Formatting 00:11:00 Create and Use Templates 00:08:00 Printing Workbooks Preview and Print a Workbook 00:10:00 Set Up the Page Layout 00:09:00 Configure Headers and Footers 00:07:00 Managing Workbooks Manage Worksheets 00:05:00 Manage Workbook and Worksheet Views 00:07:00 Manage Workbook Properties 00:06:00 Working with Functions Work with Ranges 00:18:00 Use Specialized Functions 00:11:00 Work with Logical Functions 00:23:00 Work with Date & Time Functions 00:08:00 Work with Text Functions 00:11:00 Working with Lists Sort Data 00:10:00 Filter Data 00:10:00 Query Data with Database Functions 00:09:00 Outline and Subtotal Data 00:09:00 Analyzing Data Create and Modify Tables 00:16:00 Apply Intermediate Conditional Formatting 00:07:00 Apply Advanced Conditional Formatting 00:05:00 Visualizing Data with Charts Create Charts 00:13:00 Modify and Format Charts 00:12:00 Use Advanced Chart Features 00:12:00 Using PivotTables and PivotCharts Create a PivotTable 00:13:00 Analyze PivotTable Data 00:12:00 Present Data with PivotCharts 00:07:00 Filter Data by Using Timelines and Slicers 00:11:00 Working with Multiple Worksheets and Workbooks Use Links and External References 00:12:00 Use 3-D References 00:06:00 Consolidate Data 00:05:00 Using Lookup Functions and Formula Auditing Use Lookup Functions 00:12:00 Trace Cells 00:09:00 Watch and Evaluate Formulas 00:08:00 Sharing and Protecting Workbooks Collaborate on a Workbook 00:19:00 Protect Worksheets and Workbooks 00:08:00 Automating Workbook Functionality Apply Data Validation 00:13:00 Search for Invalid Data and Formulas with Errors 00:04:00 Work with Macros 00:18:00 Creating Sparklines and Mapping Data Create Sparklines 00:07:00 MapData 00:07:00 Forecasting Data Determine Potential Outcomes Using Data Tables 00:08:00 Determine Potential Outcomes Using Scenarios 00:09:00 Use the Goal Seek Feature 00:04:00 Forecasting Data Trends 00:05:00 **Accounting Training** Professional Bookkeeper Introduction Professional Bookkeeper 00:09:00 Introduction to Accounting and Business Defining a Business 00:07:00 Ethics in Accounting 00:05:00 Generally Accepted Accounting Principles (GAAP) 00:10:00 The Accounting Equation The Accounting Equation 00:07:00 Transactions 00:11:00 Financial Statements 00:13:00 Analyzing Transactions The Accounting Equation and Transactions 00:16:00 Double-Entry System 00:11:00 Transactions - Journalizing 00:17:00 Journal Entries 00:38:00 Entering Information - Posting Entries Posting Entries 00:10:00 The Trial Balance 00:10:00 Finding Errors Using Horizontal Analysis 00:09:00 Horizontal Trend : Balance Sheet 00:21:00 Horizontal Trend: Income Statement 00:36:00 Adjusting Process The Purpose of the Adjusting Process 00:15:00 Adjusting Entries Adjusting Entries - Prepaid Expenses 00:13:00 Adjusting Entries - Accrued Revenues 00:10:00 Adjusting Entries - Depreciation Expense 00:09:00 Adjustment Summary Adjustment Summary - Review 00:13:00 Vertical Analysis 00:33:00 Preparing a Worksheet Preparing a Worksheet 00:06:00 Financial Statements The Income Statement 00:11:00 Financial Statements - Definitions 00:12:00 Completing the Accounting Cycle Temporary vs. Permanent Account 00:19:00 The Accounting Cycle Illustrated Accounting Cycle Illustrated - Steps 1-5 00:11:00 Accounting Cycle Illustrated - Steps 6-10 00:12:00 Fiscal Year Fiscal Year 00:09:00 Spreadsheet Exercise Spreadsheet Exercise - Steps 1-4 00:11:00 Spreadsheet Exercise - Steps 5-7 00:37:00

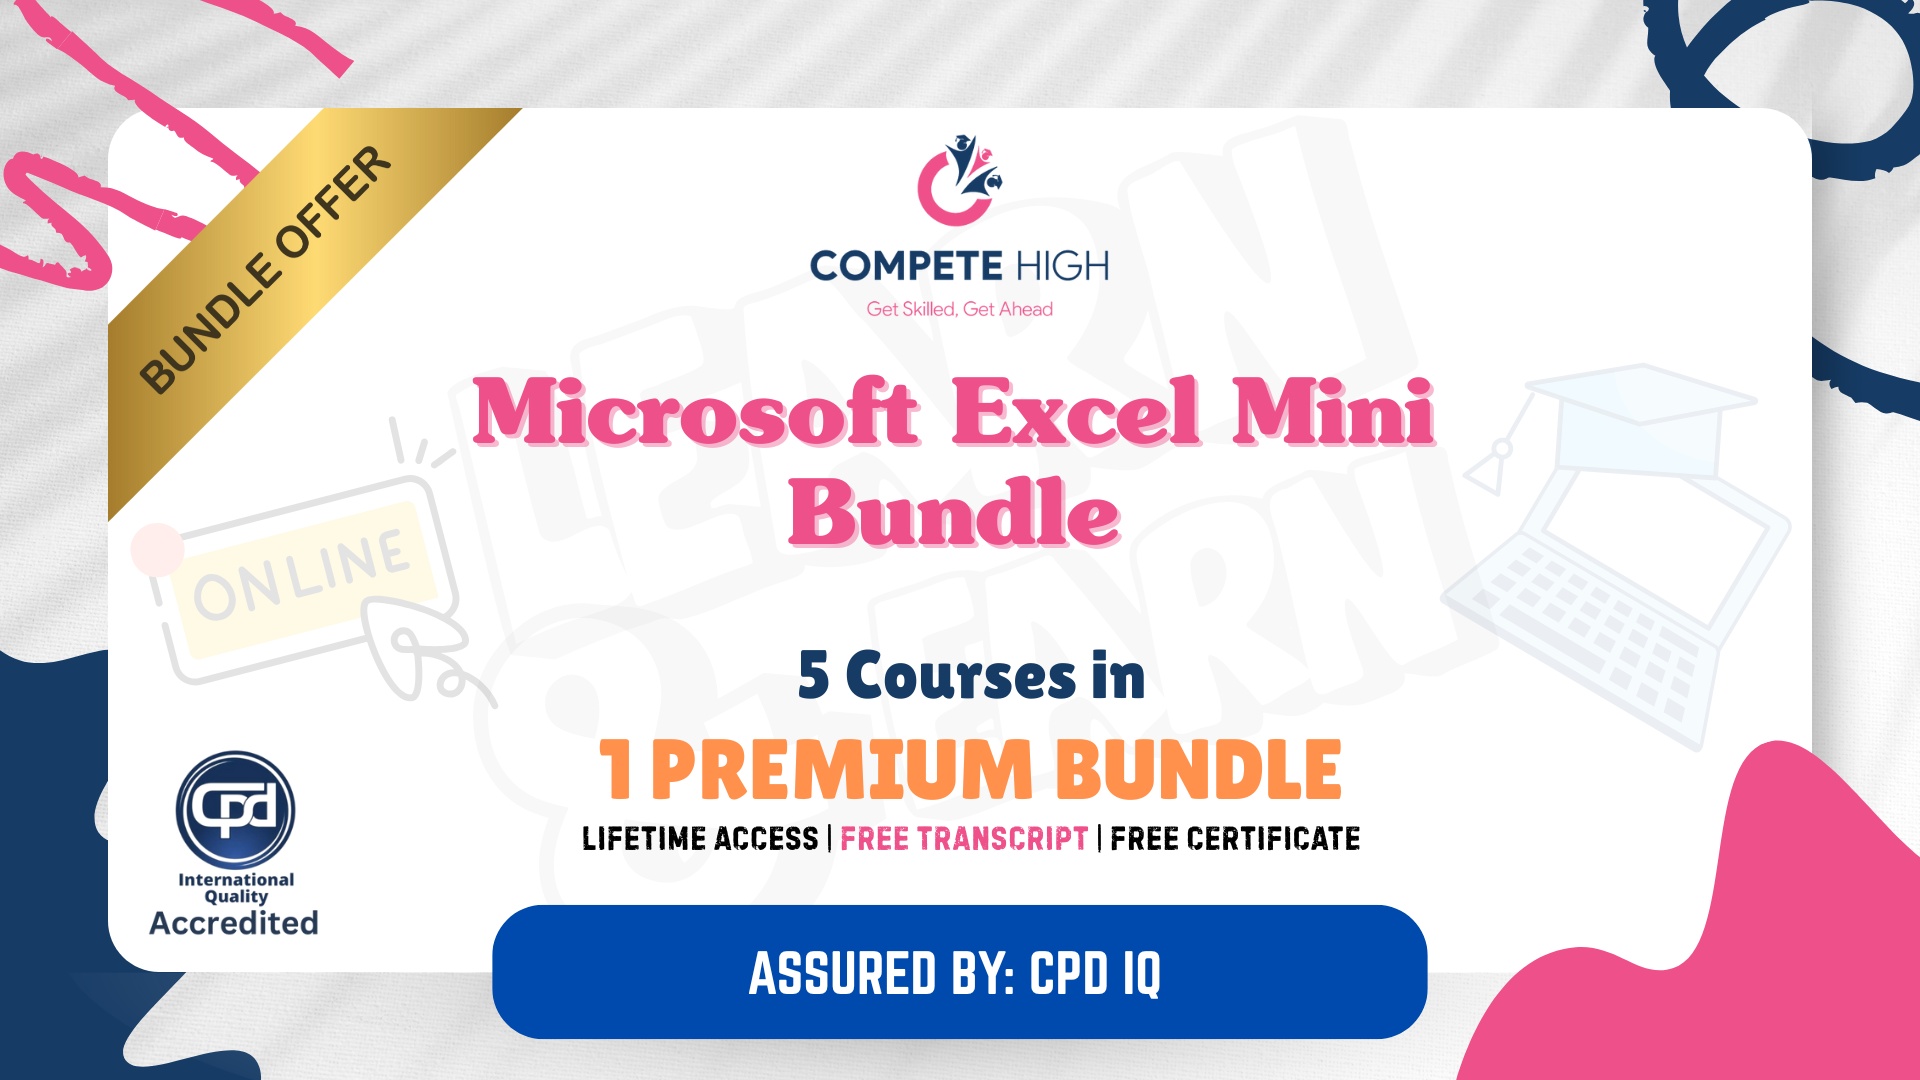
Microsoft Excel Mini Bundle
By Compete High
If spreadsheets give you a headache, this course aims to offer aspirin—metaphorically, of course. The Microsoft Excel Mini Bundle brings clarity to cells, formulas, and functions while adding the human touch of communication and the logic of mathematics. Whether you’re new to data handling or trying to stop formatting rage-quits, this bundle helps you organise, calculate, and interpret with greater ease. From raw entry to meaningful analysis, you’ll gain the structured insight needed to keep rows aligned and heads cool. Learning Outcomes: Learn to use Microsoft Excel for tables, formulas and formatting. Understand data entry principles for structured and clean records. Apply mathematical reasoning to spreadsheets and data calculations. Explore data analysis basics using Excel tools and techniques. Improve communication around data sharing and reporting tasks. Recognise how Excel supports reporting, tracking, and scheduling duties. Who is this Course For: Admins needing Excel structure and clean spreadsheet management. Beginners seeking basic Excel, maths, and data entry knowledge. Office workers handling daily tasks involving spreadsheets. Team members preparing visual reports or internal data logs. Freelancers managing schedules, budgets, and lists via Excel. Analysts looking for a refresher in data visualisation tools. Project coordinators involved in record keeping and communication. Learners improving technical communication in business settings. Career Path: Data Entry Clerk – £22,000/year Junior Data Analyst – £26,000/year Excel Support Administrator – £24,000/year Reporting Assistant – £25,500/year Office Administrator (Excel Focus) – £23,500/year Communication and Data Coordinator – £27,000/year