- Professional Development
- Medicine & Nursing
- Arts & Crafts
- Health & Wellbeing
- Personal Development
4104 Courses delivered Live Online
Tableau Desktop Training - Analyst
By Tableau Training Uk
This Tableau Desktop Training intermediate course is designed for the professional who has a solid foundation with Tableau and is looking to take it to the next level. For Private options, online or in-person, please send us details of your requirements: This Tableau Desktop training intermediate course is designed for the professional who has a solid foundation with Tableau and is looking to take it to the next level. Attendees should have a good understanding of the fundamental concepts of building Tableau worksheets and dashboards typically achieved from having attended our Tableau Desktop Foundation Course. At the end of this course you will be able to communicate insights more effectively, enabling your organisation to make better decisions, quickly. The Tableau Desktop Analyst training course is aimed at people who are used to working with MS Excel or other Business Intelligence tools and who have preferably been using Tableau already for basic reporting. The course is split into 3 phases and 9 modules: Phase 1: AMPLIFY MODULE 1: CHECK ABILITIES Revision – What I Should Know What is possibleHow does Tableau deal with dataKnow your way aroundHow do we format chartsHow Tableau deals with datesCharts that compare multiple measuresCreating Tables MODULE 2: COMBINE DATA Relationships Joining Tables – Join Types, Joining tables within the same database, cross database joins, join calculations Blending – How to create a blend with common fields, Custom defined Field relationships and mismatched element names, Calculated fields in blended data sources Unions – Manual Unions and mismatched columns, Wildcard unions Data Extracts – Creating & Editing Data extracts MODULE 3: ADVANCED CALCULATIONS Row Level v Aggregations Aggregating dimensions in calculations Changing the Level of Detail (LOD) of calculations – What, Why, How Adding Table Calculations Phase 2: ANALYSE MODULE 4: EXPAND APPLICATION Making things dynamic with parameters Sets Trend Lines How do we format charts Forecasting MODULE 5: ADVANCED MAPPING Using your own images for spatial analysis Mapping with Spatial files MODULE 6: DATA COMPARISONS Advanced Charts Bar in Bar charts Bullet graphs Creating Bins and Histograms Creating a Box & Whisker plot Phase 3: ACT MODULE 7: ADVANCED DASHBOARDS Using the dashboard interface and Device layout Dashboard Actions and Viz In tooltips Horizontal & Vertical containers Navigate between dashboards MODULE 8: PRESENT STORIES Telling data driven stories MODULE 9: ENABLE DECISIONS What is Tableau Server Publishing & Permissions How can your users engage with content This training course includes over 25 hands-on exercises and quizzes to help participants “learn by doing” and to assist group discussions around real-life use cases. Each attendee receives a login to our extensive training portal which covers the theory, practical applications and use cases, exercises, solutions and quizzes in both written and video format. Students must bring their own laptop with an active version of Tableau Desktop 2018.2 (or later) pre-installed. What People Are Saying About This Course “Course was fantastic, and completely relevant to the work I am doing with Tableau. I particularly liked Steve’s method of teaching and how he applied the course material to ‘real-life’ use-cases.”Richard W., Dashboard Consulting Ltd “This course was extremely useful and excellent value. It helped me formalise my learning and I have taken a lot of useful tips away which will help me in everyday work.” Lauren M., Baillie Gifford “I would definitely recommend taking this course if you have a working knowledge of Tableau. Even the little tips Steve explains will make using Tableau a lot easier. Looking forward to putting what I’ve learned into practice.”Aron F., Grove & Dean “Steve is an excellent teacher and has a vast knowledge of Tableau. I learned a huge amount over the two days that I can immediately apply at work.”John B., Mporium “Steve not only provided a comprehensive explanation of the content of the course, but also allowed time for discussing particular business issues that participants may be facing. That was really useful as part of my learning process.”Juan C., Financial Conduct Authority “Course was fantastic, and completely relevant to the work I am doing with Tableau. I particularly liked Steve’s method of teaching and how he applied the course material to ‘real-life’ use-cases.”Richard W., Dashboard Consulting Ltd “This course was extremely useful and excellent value. It helped me formalise my learning and I have taken a lot of useful tips away which will help me in everyday work.” Lauren M., Baillie Gifford “I would definitely recommend taking this course if you have a working knowledge of Tableau. Even the little tips Steve explains will make using Tableau a lot easier. Looking forward to putting what I’ve learned into practice.”Aron F., Grove & Dean “Steve is an excellent teacher and has a vast knowledge of Tableau. I learned a huge amount over the two days that I can immediately apply at work.”John B., Mporium
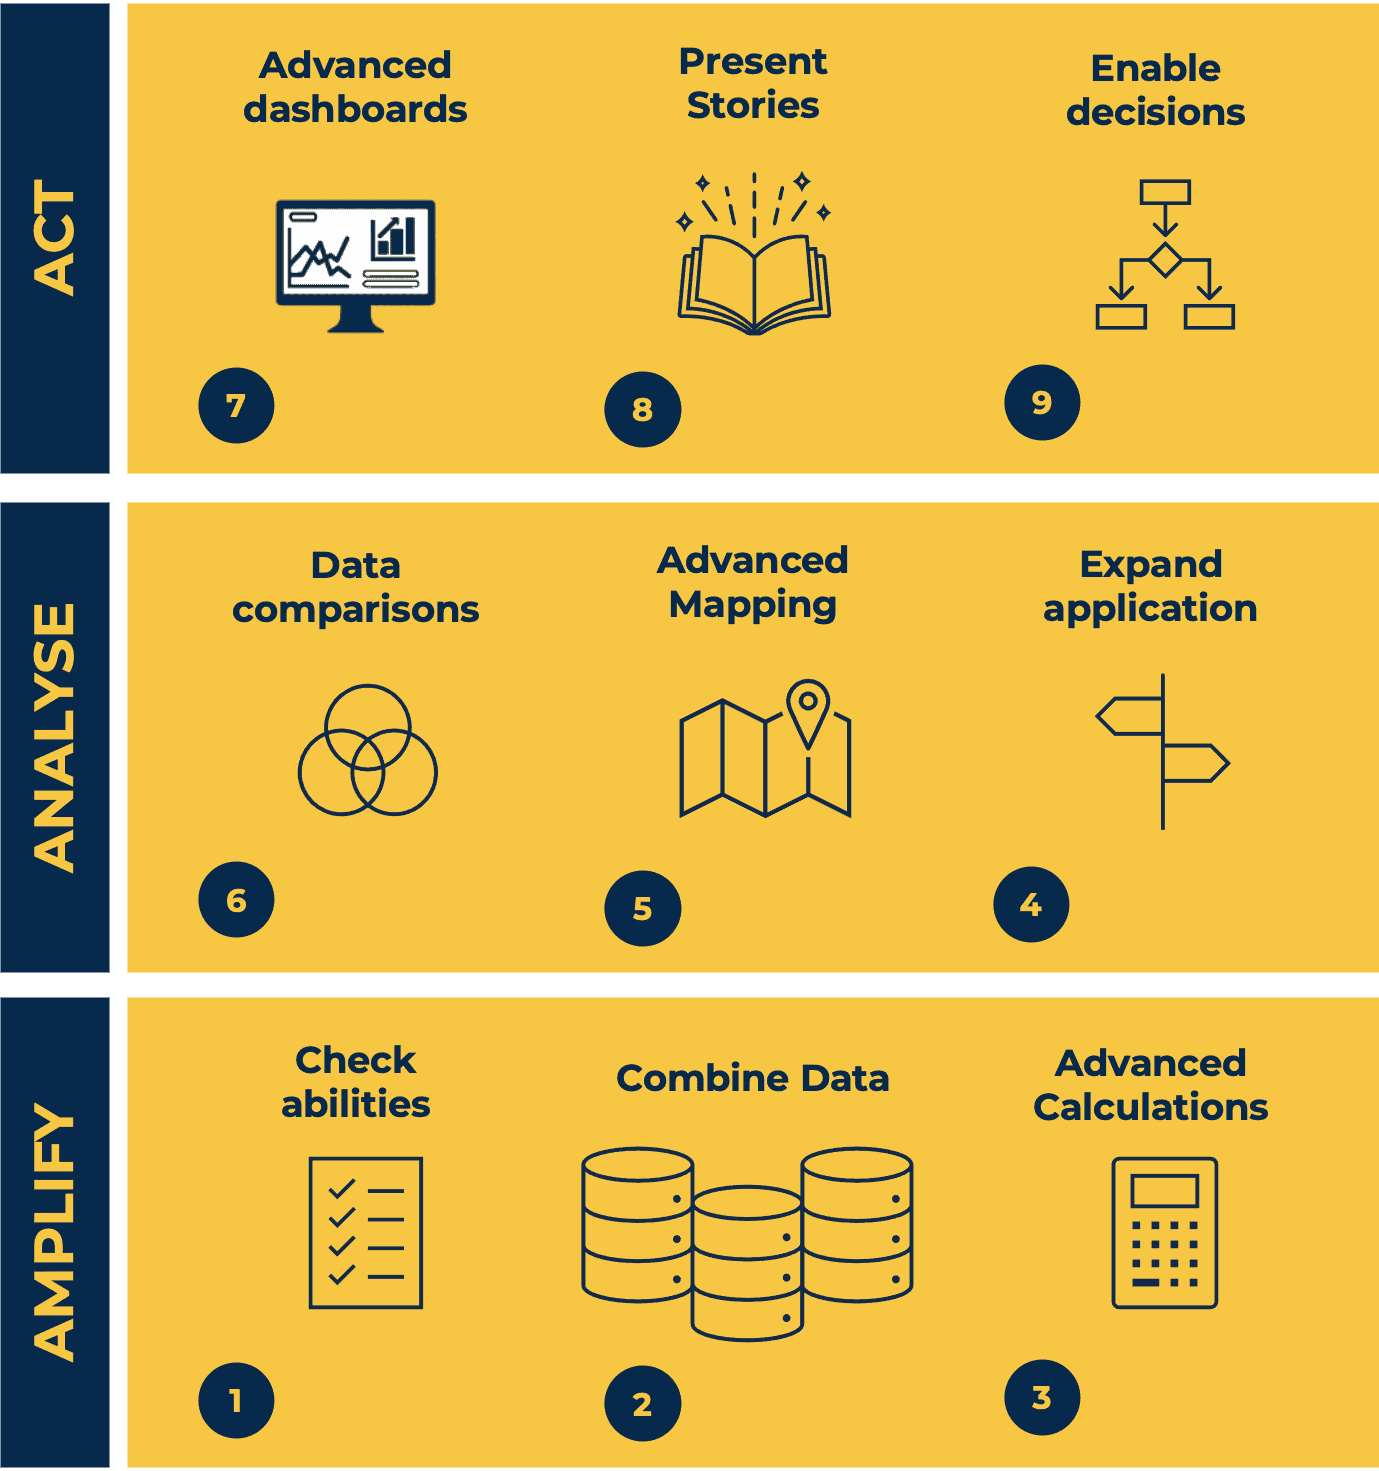
Tableau Desktop Training - Foundation
By Tableau Training Uk
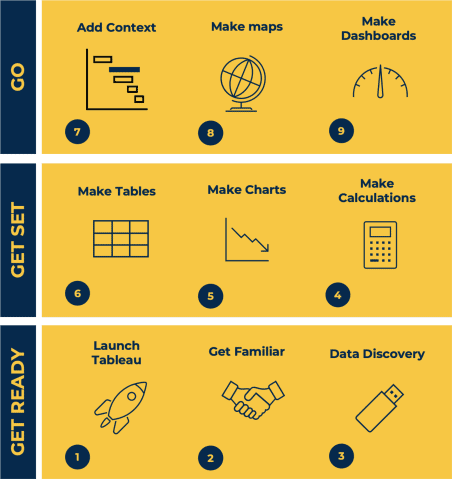
This Tableau Desktop Training course is a jumpstart to getting report writers and analysts with little or no previous knowledge to being productive. It covers everything from connecting to data, through to creating interactive dashboards with a range of visualisations in two days of your time. For Private options, online or in-person, please send us details of your requirements: This Tableau Desktop Training course is a jumpstart to getting report writers and analysts with little or no previous knowledge to being productive. It covers everything from connecting to data, through to creating interactive dashboards with a range of visualisations in two days of your time. Having a quick turnaround from starting to use Tableau, to getting real, actionable insights means that you get a swift return on your investment of time and money. This accelerated approach is key to getting engagement from within your organisation so everyone can immediately see and feel the impact of the data and insights you create. This course is aimed at someone who has not used Tableau in earnest and may be in a functional role, eg. in sales, marketing, finance, operations, business intelligence etc. The course is split into 3 phases and 9 modules: PHASE 1: GET READY MODULE 1: LAUNCH TABLEAU Check Install & Setup Why is Visual Analytics Important MODULE 2: GET FAMILIAR What is possible How does Tableau deal with data Know your way around How do we format charts Dashboard Basics – My First Dashboard MODULE 3: DATA DISCOVERY Connecting to and setting up data in Tableau How Do I Explore my Data – Filters & Sorting How Do I Structure my Data – Groups & Hierarchies, Visual Groups How Tableau Deals with Dates – Using Discrete and Continuous Dates, Custom Dates Phase 2: GET SET MODULE 4: MAKE CALCULATIONS How Do I Create Calculated Fields & Why MODULE 5: MAKE CHARTS Charts that Compare Multiple Measures – Measure Names and Measure Values, Shared Axis Charts, Dual Axis Charts, Scatter Plots Showing Relational & Proportional Data – Pie Charts, Donut Charts, Tree Maps MODULE 6: MAKE TABLES Creating Tables – Creating Tables, Highlight Tables, Heat Maps Phase 3: GO MODULE 7: ADD CONTEXT Reference Lines and Bands MODULE 8: MAKE MAPS Answering Spatial Questions – Mapping, Creating a Choropleth (Filled) Map MODULE 9: MAKE DASHBOARDS Using the Dashboard Interface Dashboard Actions This training course includes over 25 hands-on exercises and quizzes to help participants “learn by doing” and to assist group discussions around real-life use cases. Each attendee receives a login to our extensive training portal which covers the theory, practical applications and use cases, exercises, solutions and quizzes in both written and video format. Students must use their own laptop with an active version of Tableau Desktop 2018.2 (or later) pre-installed. What People Are Saying About This Course “Excellent Trainer – knows his stuff, has done it all in the real world, not just the class room.”Richard L., Intelliflo “Tableau is a complicated and powerful tool. After taking this course, I am confident in what I can do, and how it can help improve my work.”Trevor B., Morrison Utility Services “I would highly recommend this course for Tableau beginners, really easy to follow and keep up with as you are hands on during the course. Trainer really helpful too.”Chelsey H., QVC “He is a natural trainer, patient and very good at explaining in simple terms. He has an excellent knowledge base of the system and an obvious enthusiasm for Tableau, data analysis and the best way to convey results. We had been having difficulties in the business in building financial reports from a data cube and he had solutions for these which have proved to be very useful.”Matthew H., ISS Group
Minute taking (In-House)
By The In House Training Company
Meetings are a fact of working life - both virtual and physical meetings. Recording the key points from meetings is critical to making sure that accurate information is captured, and action points are clearly identified and allocated. This virtual training session will support members of staff to develop their skills in recording the key points from meetings and discussions. This course will help participants: Describe the different levels of note taking and pick the appropriate style for the meeting Prepare to take minutes in the virtual and the physical environment Liaise and work in partnership with the meeting Chair Use a template to enable the capturing of key points Set up the room ready for the meeting Identify key points to record, versus what not to record Interrupt the meeting confidently to check key points Take neutral, accurate and concise records Produce a well-laid out set of minutes. 1 Introduction Objectives and overview Introductions and personal aims 2 An introduction to minutes Purpose and use Different levels of notetaking 3 Preparing to take minutes Identifying the purpose of the meeting Working with the Chair Tips and techniques to prepare effectively Case studies, review and discussion The physical environment: setting up for a meeting 4 Listening and recording Tips and techniques to make the process easier How to interrupt a meeting What to record; what to leave out Recording in short-form using playscript and bullet-points Listening neutrally Activity: Minuting a Meeting The tricky ones and how to overcome problems in the meeting 5 Preparing the minutes Producing a set of draft minutes Tips on grammar, punctuation and layout Stylistic variation Managing feedback from the Chair 6 Review Summary of key learning points Action planning

Advanced Tableau
By Nexus Human
Duration 2.5 Days 15 CPD hours This course is intended for This course is intended for those with a basic understanding of Tableau who want to pursue mastery of the advanced features. Overview The goal of this course is to present essential Tableau concepts and its advanced functionalities to help better prepare and analyze data. This course will use Tableau Hyper, Tableau Prep and more. Getting Up to Speed ? a Review of the Basics Connecting Tableau to your data Connecting to Tableau Server Connecting to saved data sources Measure Names and Measure Values Three essential Tableau concepts Exporting data to other devices Summary All About Data ? Getting Your Data Ready Data mining and knowledge discovery process models CRISP?DM All About Data ? Joins, Blends, and Data Structures All About Data - Joins, Blends, and Data Structures Introduction to joins Introduction to complex joins Exercise: observing join culling Introduction to join calculations Introduction to spatial joins Introduction to unions Understanding data blending Order of operations No dimensions from a secondary source Introduction to scaffolding Introduction to data structures Exercise: adjusting the data structure for different questions Summary Table Calculations Table Calculations A definition and two questions Introduction to functions Directional and non-directional table calculations Application of functions Summary Level of Detail Calculations Level of Detail Calculations Building playgrounds Playground I: FIXED and EXCLUDE Playground II: INCLUDE Practical application Exercise: practical FIXED Exercise: practical INCLUDE Exercise: practical EXCLUDE Summary Beyond the Basic Chart Types Beyond the Basic Chart Types Improving popular visualizations Custom background images Tableau extensions Summary Mapping Mapping Extending Tableau's mapping capabilities without leaving Tableau Extending Tableau mapping with other technology Exercise: connecting to a WMS server Exploring the TMS file Exploring Mapbox Accessing different maps with a dashboard Creating custom polygons Converting shape files for Tableau Exercise: polygons for Texas Heatmaps Summary Tableau for Presentations Tableau for Presentations Getting the best images out of Tableau From Tableau to PowerPoint Embedding Tableau in PowerPoint Animating Tableau Story points and dashboards for Presentations Summary Visualization Best Practices and Dashboard Design Visualization Best Practices and Dashboard Design Visualization design theory Formatting rules Color rules Visualization type rules Compromises Keeping visualizations simple Dashboard design Dashboard layout Sheet selection Summary Advanced Analytics Advanced Analytics Self-service Analytics Use case ? Self-service Analytics Use case ? Geo-spatial Analytics Summary Improving Performance Improving Performance Understanding the performance-recording dashboard Exercise: exploring performance recording in Tableau desktop Performance-recording dashboard events Behind the scenes of the performance- recording dashboard Hardware and on-the-fly techniques Hardware considerations On-the-fly-techniques Single Data Source > Joining > Blending Three ways Tableau connects to data Using referential integrity when joining Advantages of blending Efficiently working with data sources Tuning data sources Working efficiently with large data sources Intelligent extracts Understanding the Tableau data extract Constructing an extract for optimal performance Exercise: summary aggregates for improved performance Optimizing extracts Exercise: materialized calculations Using filters wisely Extract filter performance Data source filter performance Context filters Dimension and measure filters Table-calculation filters Efficient calculations Boolean/Numbers > Date > String Additional performance considerations Avoid overcrowding a dashboard Fixing dashboard sizing Setting expectations Summary Additional course details: Nexus Humans Advanced Tableau training program is a workshop that presents an invigorating mix of sessions, lessons, and masterclasses meticulously crafted to propel your learning expedition forward. This immersive bootcamp-style experience boasts interactive lectures, hands-on labs, and collaborative hackathons, all strategically designed to fortify fundamental concepts. Guided by seasoned coaches, each session offers priceless insights and practical skills crucial for honing your expertise. Whether you're stepping into the realm of professional skills or a seasoned professional, this comprehensive course ensures you're equipped with the knowledge and prowess necessary for success. While we feel this is the best course for the Advanced Tableau course and one of our Top 10 we encourage you to read the course outline to make sure it is the right content for you. Additionally, private sessions, closed classes or dedicated events are available both live online and at our training centres in Dublin and London, as well as at your offices anywhere in the UK, Ireland or across EMEA.

Getting paid - telephone tactics for debt collection (In-House)
By The In House Training Company
How to protect your cash flow In the current economic climate more and more companies are finding that their customers are taking longer to pay - or are not even paying at all. As cash flow is key to the survival of any business, effective debt collection tactics are vital for all businesses. This workshop concentrates on the telephone skills and techniques you can use to achieve the most positive outcome in any debt collection situation - payment of money owed, as soon as possible, whilst keeping the collection cost as low as possible. The course will help you: Understand your debtors and communicate with them accordingly Develop a strategy for more effective debt collection Make every call count Handle difficult calls Reduce the amount of time you need to spend on chasing payment Increase your collection rates 1 The debt collection process Understanding the reasons behind payment default Looking at the debt situation from the customer's point of view Developing a strategy for effective debt collection 2 Advanced telephone communication skills Techniques for speaking to the person responsible for paying the debt How to gain the customer's trust when discussing debt Telephone collection skills best practice Key phrases that keep the conversation positive and open 3 Questioning and listening skills for gathering information Different types of question Using high-gain questions to uncover key information Active listening that will help you understand what customers are really saying Leading with examples and high-impact questions Summarising and restating 4 Overcoming objections and excuses Identifying objections Preparing suitable responses Probing objections and ways to overcome them 5 Gaining commitment and ending the call Learn how to negotiate an agreement to suit both parties Summarising actions for you and the customer Ending the call professionally 6 Dealing with difficult and challenging situations Understand different personality types The correct way to respond to an upset customer Ways to calm angry customers (and handle verbal attacks) 7 Action plans Course summary and presentation of action plans

Effective Data Visualization with Tableau
By Nexus Human
Duration 2 Days 12 CPD hours This course is intended for This course is relevant to anyone who needs to work with and understand data including: Business Analysts, Data Analysts, Reporting and BI professionals Marketing and Digital Marketing professionals Digital, Web, e-Commerce, Social media and Mobile channel professionals Business managers who need to interpret analytical output to inform managerial decisions Overview This course will cover the basic theory of data visualization along with practical skills for creating compelling visualizations, reports and dashboards from data using Tableau. Outcome: After attending this course delegates will understand - How to move from business questions to great data visualizations and beyond How to apply the fundamentals of data visualization to create informative charts How to choose the right visualization type for the job at hand How to design and develop basic dashboards in Tableau that people will love to use by doing the following: Reading data sources into Tableau Setting up the roles and data types for your analysis Creating new data fields using a range of calculation types Creating the following types of charts - cross tabs, pie and bar charts, geographic maps, dual axis and combo charts, heat maps, highlight tables, tree maps and scatter plots Creating Dashboards that delight using the all of the features available in Tableau. The use of analytics, statistics and data science in business has grown massively in recent years. Harnessing the power of data is opening actionable insights in diverse industries from banking to tourism. From Business Questions to Data Visualisation and Beyond The first step in any data analysis project is to move from a business question to data analysis and then on to a complete solution. This section will examine this conversion emphasizing: The use of data visualization to address a business need The data analytics process ? from business questions to developed dashboards Introduction to Tableau ? Part 1 In this section, the main functionality of Tableau will be explained including: Selecting and loading your data Defining data item properties Create basic calculations including basic arithmetic calculations, custom aggregations and ratios, date math, and quick table calculations Creating basic visualizations Creating a basic dashboard Introduction to Tableau ? Part 2 In this section, the main functionality of Tableau will be explained including: Selecting and loading your data Defining data item properties Create basic calculations including basic arithmetic calculations, custom aggregations and ratios, date math, and quick table calculations Creating basic visualizations Creating a basic dashboard Key Components of Good Data Visualisation and The Visualisation Zoo In this section the following topics will be covered: Colour theory Graphical perception & communication Choosing the right chart for the right job Data Exploration with Tableau Exploring data to answer business questions is one of the key uses of applying good data visualization techniques within Tableau. In this section we will apply the data visualization theory from the previous section within Tableau to uncover trends within the data to answer specific business questions. The types of charts that will be covered are: Cross Tabs Pie and bar charts Geographic maps Dual axis and combo charts with different mark types Heat maps Highlight tables Tree maps Scatter plots Introduction to Building Dashboards with Tableau In this section, we will implement the full process from business question to final basic dashboard in Tableau: Introduction to good dashboard design Building dashboards in Tableau
One of the most powerful ways to tap into intrinsic motivation is by cleaning up your mindset. The way you talk to yourself, visualise and manage your emotions is directly related to your ability to stay motivated and focused. This session will introduce you to a menu of mind hacks to help you Free your Mind?

How to take bookings for classes and workshops with Creative Workshops Scotland & Cademy
By Creative Workshops Scotland
This webinar is part of a series of free, hands-on practical webinars hosted by Cademy on how to get yourself set up to sell spaces, coordinate ticket sales and build online content. This is the first webinar in the series and the focus will be on: How to create an educator profile on Cademy How to list your workshops How to manage bookings How to configure payments with Stripe and Cademy There’s no commitment to sign up to anything, and it’s free to join in. So please share with anyone you think might be interested. We're really looking forward to meeting you.

Are you struggling with a Data Governance issue and wish you had a team of other Data Governance professionals you could bounce it around with? You’ve done Data Governance training and you know what you’re focusing on. While your team is supportive, you spend a lot of time dealing with, and driving forward, culture change, managing stakeholders, and fielding questions from people who have their own priorities and now need to do this ‘Data Governance stuff’ on top. It would be nice, once in a while, to have a conversation about how to achieve something free from internal issues. You want to talk about best practices and get some alternative ideas. That’s what my Data Governance Mastermind gives you: space to reflect with the support of your peers and practical solutions you can implement.