- Professional Development
- Medicine & Nursing
- Arts & Crafts
- Health & Wellbeing
- Personal Development
1429 Courses in Cardiff delivered Live Online
Data Analysis and Visualization with Microsoft Excel
By Nexus Human
Duration 2 Days 12 CPD hours This course is intended for This course is designed for students who already have foundational knowledge and skills in Excel and who wish to perform robust and advanced data and statistical analysis with Microsoft Excel using PivotTables, use tools such as Power Pivot and the Data Analysis ToolPak to analyze data, and visualize data and insights using advanced visualizations in charts and dashboards in Excel. To ensure success, you should have baseline skill using Microsoft Excel worksheets, particularly in creating workbooks with formulas and function Overview #NAME? Analyzing data to find issues, insights and opportunities, is now a critical part of many job roles. Beyond the analysis, data analysts in all job roles must be able to effectively present and communicate their findings in visually compelling ways. Microsoft© Excel© is designed for this purpose. Excel can connect to a wide range of data sources, perform robust data analysis and create diverse and robust data-backed visualizations to show insights, trends, and create reports. These capabilities enable people who use Excel for data analysis to turn data into thoughtful action. 1 - DATA ANALYSIS FUNDAMENTALS Introduction to Data Science Create and Modify Tables Sort and Filter Data 2 - VISUALIZING DATA WITH EXCEL Visualize Data with Charts Modify and Format Charts Apply Best Practices in Chart Design 3 - ANALYZING DATA WITH FORMULAS AND FUNCTIONS Analyze Data with Formulas and Named Ranges Analyze Data with Functions Implement Data Validation, Forms, and Controls Create Conditional Visualizations with Lookup Functions 4 - ANALYZING DATA WITH PIVOTTABLES Create a PivotTable Analyze PivotTable Data 5 - PRESENTING VISUAL INSIGHTS WITH DASHBOARDS IN EXCEL Visualize Data with PivotCharts Filter Data Using Slicers and Timelines Create a Dashboard in Excel 6 - CREATING GEOSPATIAL VISUALIZATIONS WITH EXCEL Create Map Charts in Excel Customize Map Charts in Excel 7 - PERFORMING STATISTICAL ANALYSIS Visualize Trendlines and Sparklines with Excel Analyze Data with the Data Analysis ToolPa 8 - GETTING AND TRANSFORMING DATA Connect to Data with Queries Clean and Combine Data Shape and Transform Data 9 - MODELING AND ANALYZING DATA WITH POWER PIVOT Install Power Pivot in Excel Create Data Models with Power Pivot Create Power Pivots Perform Advanced Data Analysis and Visualization 10 - PRESENTING INSIGHTS WITH REPORTS (OPTIONAL) Plan a Report Create a Report


Sexual Violence, Sexual Harassment and Harmful Sexual Behaviour
By Brightcore Consultancy
This masterclass will focus on supporting Key Safeguarding staff in understanding the current context around SVSH and HSB in your setting.

Level 3 Certificate in Assessing Vocational Achievement
By Panda Education and Training Ltd
Assessor Course

Revit One to One Basic to Advance Weekends Online or Face to Face
By Real Animation Works
Revit face to face training customised and bespoke. Online or Face to Face


This award introduces the critical concepts associated with AI and explores its relationship with the systems and processes that make up the digital ecosystem. It explores how AI can empower organisations to utilise Big Data through the use of Business Analysis and Machine Learning, and encourages candidates to consider a future vision of the world that is powered by AI.
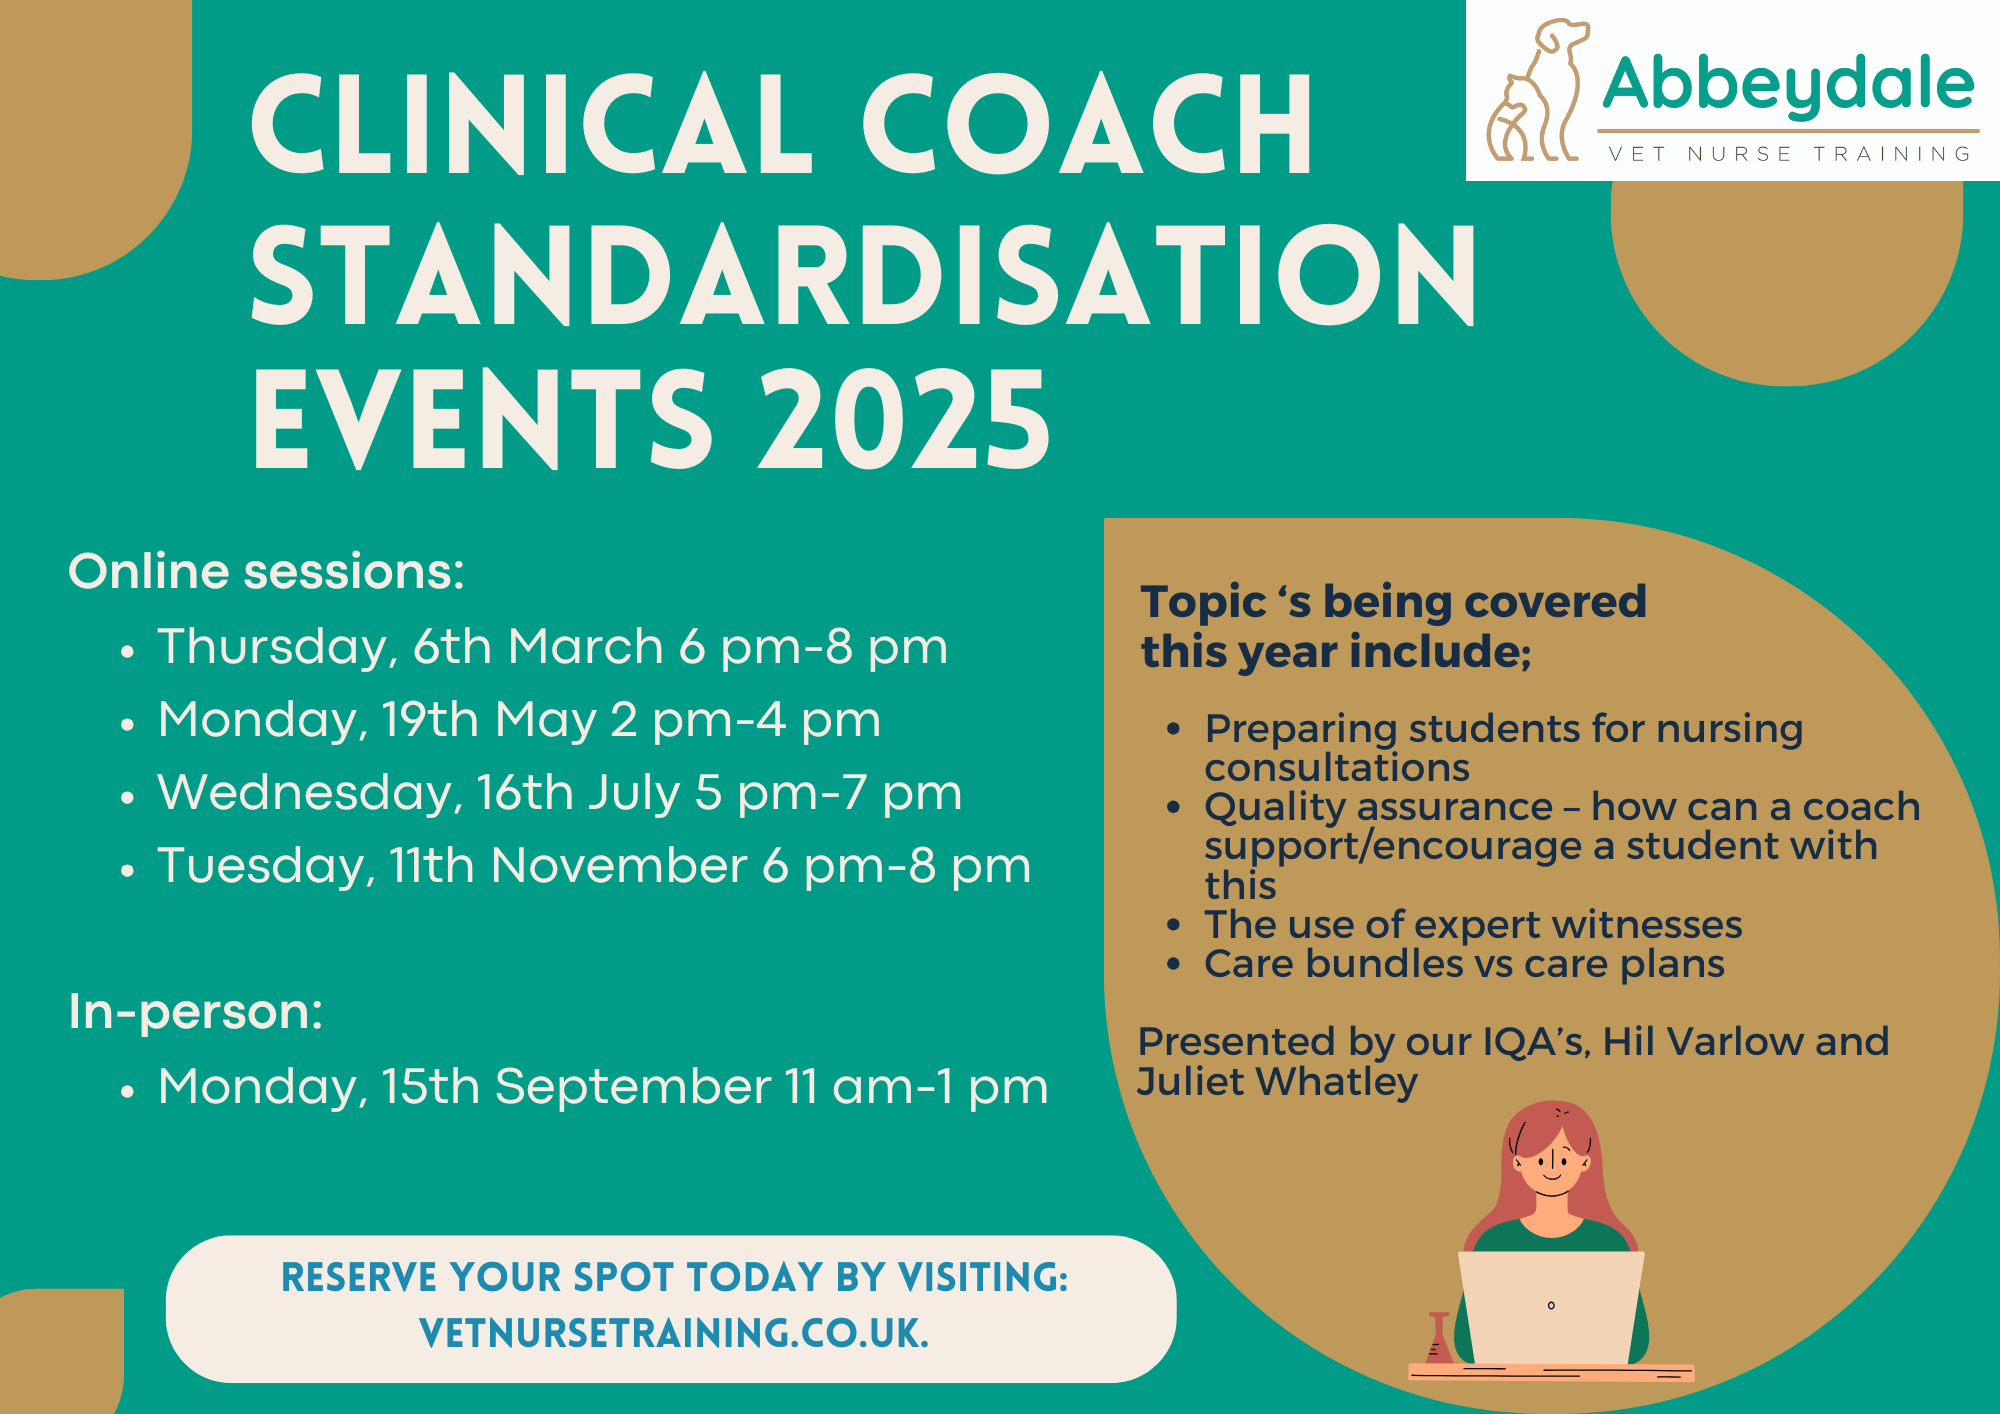
Clinical Coach Standardisation Event July 2025
By Samantha Morgan-Hourd
Clinical coach standardisation events
Overview The International English Language Testing System (IELTS) measures the language proficiency of people who want to study or work where English is used as a language of communication. We offer both group and private IELTS preparation courses. Online Trainer led IELTS Coaching. Our method Throughout the course students work on all four modules; listening, reading, writing, and speaking. We also help our students with the grammar and vocabulary knowledge they need to achieve their band score. We believe that the best way to learn exam English is to relate it to real life. Our trainer will show you how your IELTS skills can be used in every day situations and will help to achieve higher bands and fulfil the requirement of the universities and colleges.