- Professional Development
- Medicine & Nursing
- Arts & Crafts
- Health & Wellbeing
- Personal Development
27 Courses in Cardiff delivered Live Online
55125 Quick SQL Server Analysis Services
By Nexus Human
Duration 2 Days 12 CPD hours This course is intended for This course is intended for SQL professionals, Microsoft Analysis Services cube and report developers, and business intelligence professionals. Overview ?Understand common Analysis Services solutions.?Understand version changes of SSAS from 2008-2014.?Understand Analysis Services installation and architecture.?Understand how to choose the right model.?Understand the Analysis Services tools available.?Understand the multidimensional model.?Utilize data sources and data source views.?Create a cube.?Understand and utilize dimensions.?Understand and utilize attributes.?Understand and utilize relationships.?Understand and utilize hierarchies.?Understand and utilize measures and measure groups.?Understand and utilize calculated members.?Understand and utilize perspectives.?Understand and utilize translations.?Browse perspectives and translations.?Understand and utilize deployment options.?Understand and utilize processing strategies.?Understand and utilize security.?Deploy a multidimensional model.?Understand the tabular model.?Create a tabular project.?Analyze the data using Microsoft Excel.?Create and configure calculated measures and calculated fields.?Backup and Restore. This course is intended for IT professionals who are interested in quickly learning how to utilize an Analysis Services multidimensional or tabular solution. Course Overview Introduction Course Materials Facilities Prerequisites What We'll Be Discussing Lab 1: Course Overview Introduction to Microsoft SQL Server Analysis Services Common Analysis Services Solutions Version Changes of SSAS from 2008-2014 Analysis Services Installation and Architecture: One Product, Two Models Choosing the Right Model Analysis Services Tools Lab 1: Introduction to Microsoft SQL Server Analysis Services The Multidimensional Solution Understanding the Multidimensional Model Utilizing Data Sources and Data Source Views Creating a Cube Lab 1: The Multidimensional Solution Dissecting with Dimensions Developing Dimensions Utilizing Attributes Relating with Relationships Handling Hierarchies Lab 1: Dissecting with Dimensions Managing Measures Measures and Measure Groups Calculated Members Lab 1: Managing Measures Configuring Cube Options Understanding Perspectives Utilizing Translations Browsing Perspectives and Translations Lab 1: Configuring Cube Options Deploying Examining Deployment Options Processing Strategies Exploring Security Lab 1: Deploying The Tabular Solution Understanding the Tabular Model Creating a Tabular Project Deploying Browsing the Model Querying the Solution and Understanding DAX Maintaining and Optimizing Lab 1: The Tabular Solution

Power BI Introduction
By Underscore Group
Learn how to use this powerful tool to import and clean data and create some amazing visuals. Course overview Duration: 2 days (13 hours) Power BI Desktop is a powerful tool for working with your data. It enables you to import multiple data sources and create effective visualisations and reports. This course is an introduction to Power BI to get you started on creating a powerful reporting capability. You should have a good working knowledge of Excel and managing data before attending. Objectives By the end of the course you will be able to: Import data from multiple data sources Edit and transform data before importing Create reports Create different visualisations Create data models Build data relationships Use the drill down features Create measures Use the Power BI Service Build dashboards Use the mobile app Content Essentials Importing Data Power BI Overview Data sources Importing data Transforming Your Data Editing your data Setting data types Removing columns/rows Choosing columns to keep Setting header rows Splitting columns Creating Reports Creating and saving reports Adding pages Renaming pages Interactivity Refreshing your data Adding Columns Columns from example Custom columns Conditional columns Append Queries Importing folders Setting up and using append queries Creating Chart Visualisations Adding chart elements Choosing chart types Setting properties Setting values, axis and legends Using tooltips Visual filters Setting page and report filters Creating Tables, Cards, Gauges and Maps Adding table elements Adding maps Working with cards Working with matrices KPIs and Gauges Conditional Formatting Setting rules Removing conditional formatting Working with Data Models Merge Queries Setting up and using merge queries Merging in columns of data Creating a Data Model The data model Multiple data tables Connecting tables Building relationships Relationship types Building visuals from multiple tables Unpivoting Data Working with summary data Unpivoting data Using Hierarchies Using built in hierarchies Drill down Drill up See next level Expand a hierarchy Create a new hierarchy Grouping Grouping text fields Grouping date and number fields Creating Measures DAX functions DAX syntax Creating a new measure Using quick measures Using the PowerBI Service Shared workspaces My workspace Dashboards Reports Datasets Drill down in dashboards Focus mode Using Q&A Refreshing data Using Quick Insights Power BI Mobile App Using the Power BI Mobile App

Microsoft Power BI: Data Analysis Practitioner (Second Edition) (v1.3)
By Nexus Human
Duration 2 Days 12 CPD hours This course is intended for This course is designed for professionals in a variety of job roles who are currently using desktop or web-based data management tools such as Microsoft Excel or SQL Server reporting services to perform numerical or general data analysis. They are responsible for connecting to cloud-based data sources, as well as shaping and combining data for the purpose of analysis. They are also looking for alternative ways to analyze business data, visualize insights, and share those insights with peers across the enterprise. This includes capturing and reporting on data to peers, executives, and clients. Overview In this course, you will analyze data with Microsoft Power BI. You will: Analyze data with self-service BI. Connect to data sources. Perform data cleaning, profiling, and shaping. Visualize data with Power BI. Enhance data analysis by adding and customizing visual elements. Model data with calculations. Create interactive visualizations. As technology progresses and becomes more interwoven with our businesses and lives, more data is collected about business and personal activities. This era of 'big data' is a direct result of the popularity and growth of cloud computing, which provides an abundance of computational power and storage, allowing organizations of all sorts to capture and store data. Leveraging that data effectively can provide timely insights and competitive advantages. Creating data-backed visualizations is key for data scientists, or any professional, to explore, analyze, and report insights and trends from data. Microsoft© Power BI© software is designed for this purpose. Power BI was built to connect to a wide range of data sources, and it enables users to quickly create visualizations of connected data to gain insights, show trends, and create reports. Power BI's data connection capabilities and visualization features go far beyond those that can be found in spreadsheets, enabling users to create compelling and interactive worksheets, dashboards, and stories that bring data to life and turn data into thoughtful action. Analyzing Data with Self-Service BI Topic A: Data Analysis and Visualization for Business Intelligence Topic B: Self-Service BI with Microsoft Power BI Connecting to Data Sources Topic A: Create Data Connections Topic B: Configure and Manage Data Relationships Topic C: Save Files in Power BI Performing Data Cleaning, Profiling, and Shaping Topic A: Clean, Transform, and Load Data with the Query Editor Topic B: Profile Data with the Query Editor Topic C: Shape Data with the Query Editor Topic D: Combine and Manage Data Rows Visualizing Data with Power BI Topic A: Create Visualizations in Power BI Topic B: Chart Data in Power BI Enhancing Data Analysis Topic A: Customize Visuals and Pages Topic B: Incorporate Tooltips Modeling Data with Calculations Topic A: Create Calculations with Data Analysis Expressions (DAX) Topic B: Create Calculated Measures and Conditional Columns Creating Interactive Visualizations Topic A: Create and Manage Data Hierarchies Topic B: Filter and Slice Reports Topic C: Create Dashboards Additional course details: Nexus Humans Microsoft Power BI: Data Analysis Practitioner (Second Edition) (v1.3) training program is a workshop that presents an invigorating mix of sessions, lessons, and masterclasses meticulously crafted to propel your learning expedition forward. This immersive bootcamp-style experience boasts interactive lectures, hands-on labs, and collaborative hackathons, all strategically designed to fortify fundamental concepts. Guided by seasoned coaches, each session offers priceless insights and practical skills crucial for honing your expertise. Whether you're stepping into the realm of professional skills or a seasoned professional, this comprehensive course ensures you're equipped with the knowledge and prowess necessary for success. While we feel this is the best course for the Microsoft Power BI: Data Analysis Practitioner (Second Edition) (v1.3) course and one of our Top 10 we encourage you to read the course outline to make sure it is the right content for you. Additionally, private sessions, closed classes or dedicated events are available both live online and at our training centres in Dublin and London, as well as at your offices anywhere in the UK, Ireland or across EMEA.
Microsoft Power BI: Data Analysis Professional (Second Edition) (v1.3)
By Nexus Human
Duration 3 Days 18 CPD hours This course is intended for This course is designed for professionals in a variety of job roles who are currently using desktop or web-based data management tools such as Microsoft Excel or SQL Server reporting services to perform numerical or general data analysis. They are responsible for connecting to cloud-based data sources, as well as shaping and combining data for the purpose of analysis. They are also looking for alternative ways to analyze business data, visualize insights, and share those insights with peers across the enterprise. This includes capturing and reporting on data to peers, executives, and clients. This course is also designed for professionals who want to pursue the Microsoft Power BI Data Analyst (Exam PL-300) certification. Overview In this course, you will analyze data with Microsoft Power BI. You will: Analyze data with self-service BI. Connect to data sources. Perform data cleaning, profiling, and shaping. Visualize data with Power BI. Enhance data analysis by adding and customizing visual elements. Model data with calculations. Create interactive visualizations. Use advanced analysis techniques. Enhance reports and dashboards. Publish and share reports and dashboards. Extend Power BI beyond the desktop. As technology progresses and becomes more interwoven with our businesses and lives, more data is collected about business and personal activities. This era of 'big data' is a direct result of the popularity and growth of cloud computing, which provides an abundance of computational power and storage, allowing organizations of all sorts to capture and store data. Leveraging that data effectively can provide timely insights and competitive advantages. Creating data-backed visualizations is key for data scientists, or any professional, to explore, analyze, and report insights and trends from data. Microsoft© Power BI© software is designed for this purpose. Power BI was built to connect to a wide range of data sources, and it enables users to quickly create visualizations of connected data to gain insights, show trends, and create reports. Power BI's data connection capabilities and visualization features go far beyond those that can be found in spreadsheets, enabling users to create compelling and interactive worksheets, dashboards, and stories that bring data to life and turn data into thoughtful action. Analyzing Data with Self-Service BI Topic A: Data Analysis and Visualization for Business Intelligence Topic B: Self-Service BI with Microsoft Power BI Connecting to Data Sources Topic A: Create Data Connections Topic B: Configure and Manage Data Relationships Topic C: Save Files in Power BI Performing Data Cleaning, Profiling, and Shaping Topic A: Clean, Transform, and Load Data with the Query Editor Topic B: Profile Data with the Query Editor Topic C: Shape Data with the Query Editor Topic D: Combine and Manage Data Rows Visualizing Data with Power BI Topic A: Create Visualizations in Power BI Topic B: Chart Data in Power BI Enhancing Data Analysis Topic A: Customize Visuals and Pages Topic B: Incorporate Tooltips Modeling Data with Calculations Topic A: Create Calculations with Data Analysis Expressions (DAX) Topic B: Create Calculated Measures and Conditional Columns Creating Interactive Visualizations Topic A: Create and Manage Data Hierarchies Topic B: Filter and Slice Reports Topic C: Create Dashboards Using Advanced Analysis Techniques Topic A: Create Calculated Tables, Variables, and Parameters Topic B: Enhance Visuals with Statistical Analysis Topic C: Perform Advanced Analysis Enhancing Reports and Dashboards Topic A: Enhance Reports Topic B: Enhance Dashboards Publishing and Sharing Reports and Dashboards Topic A: Publish Reports Topic B: Create and Manage Workspaces Topic C: Share Reports and Dashboards Extending Power BI Beyond the Desktop Topic A: Use Power BI Mobile Topic B: Extend Access with the Power BI API Additional course details: Nexus Humans Microsoft Power BI: Data Analysis Professional (Second Edition) (v1.3) training program is a workshop that presents an invigorating mix of sessions, lessons, and masterclasses meticulously crafted to propel your learning expedition forward. This immersive bootcamp-style experience boasts interactive lectures, hands-on labs, and collaborative hackathons, all strategically designed to fortify fundamental concepts. Guided by seasoned coaches, each session offers priceless insights and practical skills crucial for honing your expertise. Whether you're stepping into the realm of professional skills or a seasoned professional, this comprehensive course ensures you're equipped with the knowledge and prowess necessary for success. While we feel this is the best course for the Microsoft Power BI: Data Analysis Professional (Second Edition) (v1.3) course and one of our Top 10 we encourage you to read the course outline to make sure it is the right content for you. Additionally, private sessions, closed classes or dedicated events are available both live online and at our training centres in Dublin and London, as well as at your offices anywhere in the UK, Ireland or across EMEA.
Microsoft Power BI Masterclass 2021
By NextGen Learning
Microsoft Power BI Masterclass 2021 Course Overview: The "Microsoft Power BI Masterclass 2021" provides learners with the skills to become proficient in data analysis and visualization using Power BI. This comprehensive course covers the core functionalities of Power BI, from data preparation and transformation to creating impactful reports and dashboards. Learners will gain valuable insights into data modelling, visualisation, and the use of DAX for advanced calculations. By the end of the course, participants will be able to apply their knowledge to real-world projects, improving their ability to communicate data-driven insights effectively. This course is ideal for professionals and beginners who want to leverage Power BI to unlock the potential of their data. Course Description: This masterclass delves into the essential features of Microsoft Power BI, guiding learners through every stage of data analysis. Starting with project setup and data transformation in the Query Editor, the course progresses to advanced topics such as DAX functions and data storytelling. Learners will explore how to build data models, create dashboards, and employ Python in Power BI to enhance their reports. The course also covers Power BI Service for cloud-based analytics, row-level security for data protection, and integrating additional data sources. With a focus on empowering users to communicate insights clearly, the course ensures learners gain the expertise to manage data efficiently, make informed decisions, and stay up to date with evolving tools and features. Microsoft Power BI Masterclass 2021 Curriculum: Module 01: Introduction Module 02: Preparing our Project Module 03: Data Transformation - The Query Editor Module 04: Data Transformation - Advanced Module 05: Creating a Data Model Module 06: Data Visualization Module 07: Power BI & Python Module 08: Storytelling with Data Module 09: DAX - The Essentials Module 10: DAX - The CALCULATE function Module 11: Power BI Service - Power BI Cloud Module 12: Row-Level Security Module 13: More data sources Module 14: Next steps to improve & stay up to date (See full curriculum) Who is this course for? Individuals seeking to enhance their data analysis skills. Professionals aiming to advance their data visualization expertise. Beginners with an interest in data science or business analytics. Business analysts or data professionals looking to upskill in Power BI. Career Path: Data Analyst Business Intelligence Analyst Data Scientist Power BI Developer Reporting Analyst Data Visualisation Expert

Kick Start Your Career with CompTIA's Data Analysis Certification - Live Classes
(1)By Media Tek Training Solutions Ltd
Get job ready with CompTIA's Data Analysis Certification. Live Classes - Career Guidance - Exam Included.
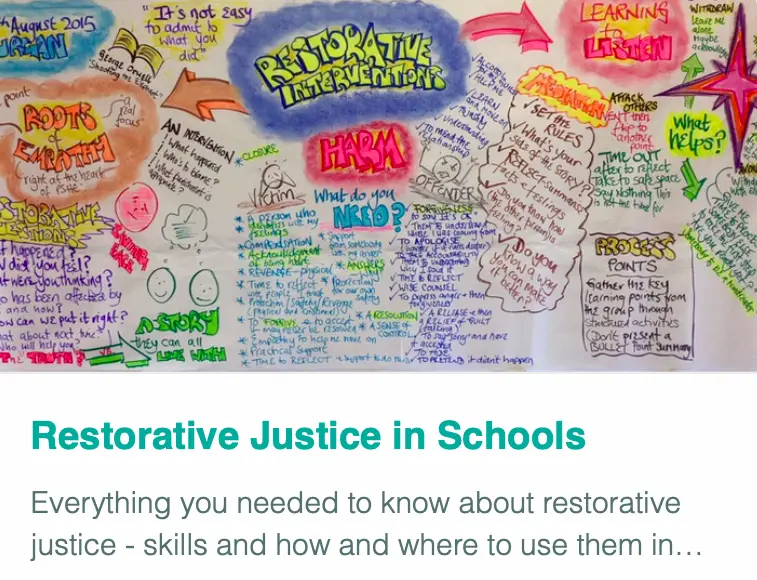
Restorative Justice
By Inclusive Solutions
Restorative Interventions in Schools A “Restorative Solution” is a non-adversarial approach to conflict resolution where the person who has done something wrong in a given situation becomes accountable to those s/he has harmed. This person is then given the opportunity to “make up” for their inappropriate behaviour through agreement and reparation. An intervention can involve a formal conference, or it can be a simple conversation on a corridor or playground. Restorative Interventions work with all ages of young people, and the techniques can be used in parental meetings, can prevent exclusions and challenge poor behaviour. Our feedback tells us that when problems between young people are addressed in this way, those problems rarely reoccur. Course Category Behaviour and Relationships Teaching and Learning Description Restorative Interventions in Schools A “Restorative Solution” is a non-adversarial approach to conflict resolution where the person who has done something wrong in a given situation becomes accountable to those s/he has harmed. This person is then given the opportunity to “make up” for their inappropriate behaviour through agreement and reparation. An intervention can involve a formal conference, or it can be a simple conversation on a corridor or playground. Restorative Interventions work with all ages of young people, and the techniques can be used in parental meetings, can prevent exclusions and challenge poor behaviour. Our feedback tells us that when problems between young people are addressed in this way, those problems rarely reoccur. Also Available on line– self paced learning… give it a try! Testimonials ‘Interesting. A different approach. Another ‘weapon’ in the armoury. Will try to use.’ ‘Made me think how I can approach confrontations differently. Useful, reminded me where my focus should be and that things will be difficult at times, but that’s no excuse to stay in the comfort zone!’ ‘Excellent day. Lots of ideas to take away and use on a daily basis. Thanks.’ ‘Nice to do some work on behaviour without sanctions and restraints in mind’ Learning Objectives To introduce participants to Restorative Interventions To develop understanding of value and role in developing inclusive practice of Restorative Interventions To develop and practise Restorative Intervention skills processes Opportunity to reflect on professional practice Mutual support established with other ‘front line’ practitioners Who Is It For ? Multi Agency Teams Social workers CAMHS teams Year Managers Primary and secondary staff Early Years and School based Practitioners Heads and Deputies SENCOs Advanced Skills Teachers Primary and secondary teachers Local Authority Support Services Course Content This can be introduced in one day or as a workshop but is better offered over a series of sessions. The course answers the questions: What should we do if rewards and punishments do not work? Can we find an alternative process to recommending permanent exclusion or special unit or school placement? Struggling with a child for whom praise and sanctions seem ineffective? Want to develop a more restorative school or team? I need a process which works with relationships not just behaviour. What will work for our relationships policy? This day’s training will enable participants to facilitate Short Restorative Conferences, and will suggest ways of working with young people and others that will help to repair broken relationships, and challenge some difficult behaviour. Including all those affected by an incident in its resolution is a powerful way of producing significant improvements in behaviour. We will cover: What are restorative solutions? Background and detailed teaching of processes Inclusion values underpinning this work Processes modelled and opportunities to try process out Practical setting up of restorative conferences Stories and outcomes