- Professional Development
- Medicine & Nursing
- Arts & Crafts
- Health & Wellbeing
- Personal Development
Primary Ballet
By M & L School of Performing Arts
Every Saturday at 9:10 – 9:55 As our students gracefully progress through their ballet journey at M & L School of Performing Arts, a new horizon unfolds with the option to embark on their very first ballet examination. This milestone is a testament to their dedication, yet we hold the philosophy that the path of ballet is as unique as each dancer; thus, participation in exams is entirely voluntary. For those who feel the call to delve deeper, pursuing an exam offers a structured opportunity to refine their technique and immerse themselves in the discipline of ballet. The choice to undertake an exam goes beyond the dance studio; it’s a lesson in self-discipline, a challenge that beckons our young dancers to dedicate themselves to practice and perfection. It’s about setting a goal that’s not just about leaps and turns but about growth and self-discovery. Our curriculum is designed not only to prepare students for these exams but to instill a sense of accomplishment and motivation, driving them to reach new heights. Ballet, at its core, is an expression of the soul. It’s about listening not just to the music but to the silent cues of movement and harmony. It teaches our dancers the value of precise instruction, the beauty of individuality, and the strength found in unity. Through ballet, our students develop not just in technique but in life skills: coordination, posture, strength, and flexibility are nurtured alongside artistry and a love for music. At this pivotal stage, our focus intensifies on Classical Ballet technique, laying a solid foundation for both the art and the artist. As physical prowess and confidence flourish, our dancers are encouraged to express their creativity and emotions through their movements, further deepening their connection to the art form. The M & L School of Performing Arts is not just about ballet; it’s a sanctuary where young artists grow, inspired by the discipline, beauty, and expressive power of dance. Book first lesson here: https://mandlschoolofperformingarts.com/book-first-lesson/

Access - introduction (In-House)
By The In House Training Company
This one-day workshop is ideal for those looking to work with existing databases as well as creating a new Access database. You will learn effective ways to enter and extract data and convert data into a well-presented format for reports. This course will help participants: Plan and create a database Sort and filter records Use field data types Work with tables Create and manage a query Create and work with forms, and use the form wizard View, create and print reports 1 Access introduced Planning a database Creating a blank database Opening an existing database Security warnings The navigation pane Previewing database components Closing an Access database 2 Tables introduced Viewing and navigating table data Navigating using keyboard shortcuts Editing table data Adding records to tables Selecting and deleting records Finding and replacing data Filtering tables Summing table data 3 Queries introduced Opening a query in datasheet view Opening a query in design view Adding fields to a query Sorting query results Modifying datasheet view Saving and closing queries 4 Forms introduced Working with form data Sorting records Filtering records Working in design and layout views Changing object attributes 5 Reports introduced Opening and viewing reports Viewing a report in design view Previewing and printing report data Creating reports with auto report Creating reports with the report wizard Changing field attributes 6 Creating a new database Creating database tables Creating table fields Selecting field data types 7 Table relationships Introducing relationships Establishing table relationships The one-to-many relationship type Establishing referential integrity 8 Creating queries Streamline query criteria using wildcards Creating summary queries Creating queries based on criteria Running date queries Formatting field properties Building queries from multiple tables Summing in queries 9 Creating forms Creating a new form Inserting form fields Working with the property sheet The command button wizard The command button wizard Programming without typing Creating forms with embedded sub forms Creating forms with the sub form wizard Creating forms with the form wizard 10 Creating reports What are report bands? Managing report controls Basing reports on multiple tables Basing reports on queries Sorting and grouping records

Bravery & Womanhood
By Person Irresponsible
bravery and women, overcoming fears of solo travel, the great outdoors alone

Non-licensed training for land remediation contractors
By Airborne Environmental Consultants Ltd
We have developed the non-licensed training to cover work for land remediation contractors working on asbestos-contaminated sites. Including: Interpretation of CAR Regulations to asbestos-contaminated land. This will include 'litter-picking' surface contamination and form contaminated soil. Site segregation, decontamination procedures and air monitoring expectations.

Power BI - advanced (1 day) (In-House)
By The In House Training Company
This course starts with data transformation strategies, exploring capabilities in the Power Query Editor, and data-cleansing practices. It looks at the Advanced Query Editor to view the M language code. This course focuses on advanced DAX measures that include filtering conditions, with a deep dive into time intelligence measures. Like the M query language, DAX is a rich functional language that supports variables and expression references. This course also looks at the creation of dynamic dashboards and incorporates a range of visualisations available in Power BI Desktop and online in the AppSource. The course finishes with a look at setting up end user level security in tables. 1 The query editor Split by row delimiter AddDays to determine deadlines Advanced query editor 2 Fuzzy matching joins Matching inconsistencies by percentage Matching with transformation table 3 Logical column functions Logical functions IF, AND, OR Using multiple conditions Including FIND in functions 4 Editing DAX measures Make DAX easier to read Add comments to a measure Using quick measures 5 The anatomy of CALCULATE Understanding CALCULATE context filters Adding context to CALCULATE with FILTER Using CALCULATE with a threshold 6 The ALL measure Anatomy of ALL Create an ALL measure Using ALL as a filter Use ALL for percentage 7 DAX iterators Anatomy of iterators A closer look at SUMX Using RELATED in SUMX Create a RANKX RANKX with ALL 8 Date and time functions Overview of functions Create a DATEDIFF function 9 Time intelligent measures Compare historical monthly data Create a DATEADD measure Creating cumulative totals Creating cumulative measures Visualising cumulative totals 10 Visualisations in-depth Utilising report themes Create a heatmap Comparing proportions View trends with sparklines Group numbers using bins Setting up a histogram 11 Comparing variables Visualising trendlines as KPI Forecasting with trendlines Creating a scatter plot Creating dynamic labels Customised visualisation tooltips Export reports to SharePoint 12 User level security Setting up row level security Testing user security
Power BI - dashboards (1 day) (In-House)
By The In House Training Company
Power BI is a powerful data visualisation program that allows businesses to monitor data, analyse trends, and make decisions. This course is designed to provide a solid understanding of the reporting side of Power BI, the dashboards, where administrators, and end users can interact with dynamic visuals that communicates information. This course focuses entirely on the creation and design of visualisations in dashboards, including a range of chart types, engaging maps, and different types of tables. Designing dashboards with KPI's (key performance indicators), heatmaps, flowcharts, sparklines, and compare multiple variables with trendlines. This one-day programme focuses entirely on creating dashboards, by using the many visualisation tools available in Power BI. You will learn to build dynamic, user-friendly interfaces in both Power BI Desktop and Power BI Service. 1 Introduction Power BI ecosystem Things to keep in mind Selecting dashboard colours Importing visuals into Power BI Data sources for your analysis Joining tables in Power BI 2 Working with data Utilising a report theme Table visuals Matrix visuals Drilling into hierarchies Applying static filters Group numbers with lists Group numbers with bins 3 Creating visuals Heatmaps in Power BI Visualising time-intelligence trends Ranking categorical totals Comparing proportions View trends with sparklines 4 Comparing variables Insert key performance indicators (KPI) Visualising trendlines as KPI Forecasting with trendlines Visualising flows with Sankey diagrams Creating a scatter plot 5 Mapping options Map visuals Using a filled map Mapping with latitude and longitude Mapping with ArcGIS or ESRI 6 Creating dashboards High-level dashboard Migration analysis dashboard Adding slicers for filtering Promote interaction with nudge prompts Searching the dashboard with a slicer Creating dynamic labels Highlighting key points on the dashboard Customised visualisation tooltips Syncing slicers across pages 7 Sharing dashboards Setting up and formatting phone views Exporting data Creating PDF files Uploading to the cloud Share dashboards in SharePoint online
Connect, Communicate, Collaborate
By Genos International Europe
This dynamic programme empowers attendees to enhance their emotional intelligence, forge meaningful connections in every interaction, engage in impactful coaching conversations, and cultivate resilience and psychological safety. Through interactive workshops, compelling discussions, and practical exercises, participants will acquire skills and insights necessary to foster a space for collaboration helping shape an environment of trust and openness in their professional and personal spaces

Workplace Happiness - Half Day Workshop
By The Happy Business School
A half day workshop exploring practical ways we can invest in our workplace happiness.

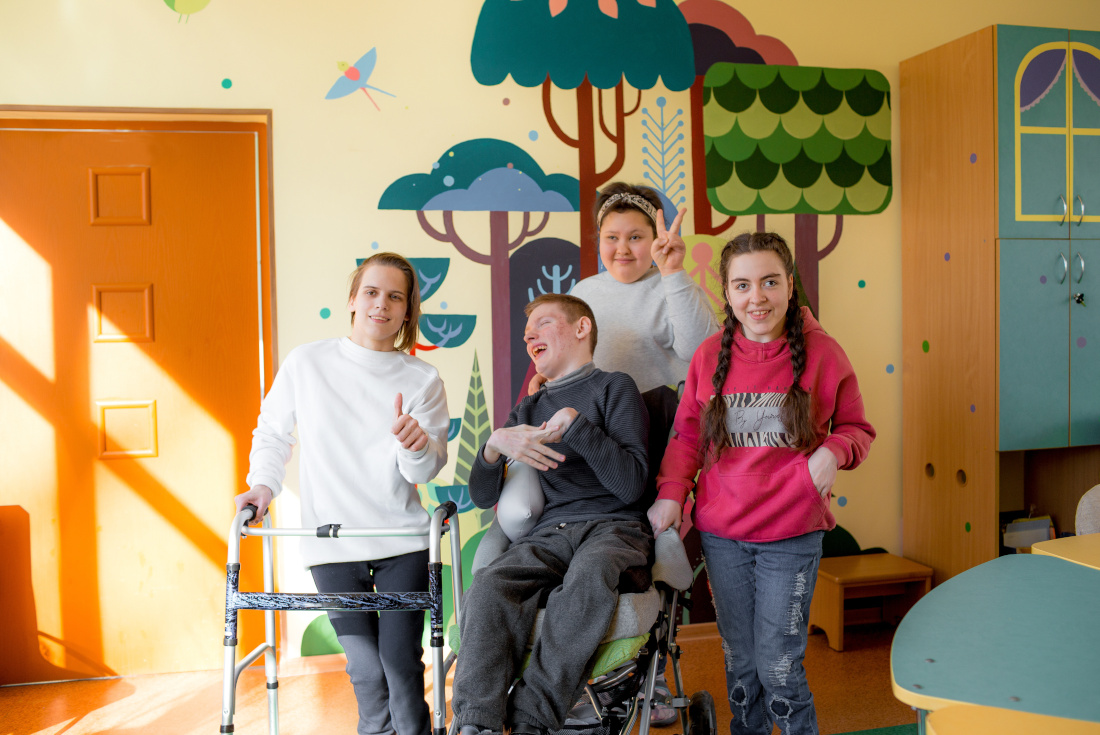
Learning Disability Awareness
By Prima Cura Training
It is estimated that more than 1.2 million people in the UK are living with a learning disability. Healthcare and social care workers must have an adequate understanding of the needs of people with learning disabilities. It is also essential that they listen to the needs, hopes and aspirations of those living with learning disabilities, their careers, friends, and families. An improved knowledge, together with current guidance and best practice recommendations help to improve the care provided to people who have learning disabilities.